Why B2B Benchmarking is NOT a good idea!

Am I better than the competition?

If I got a penny for every time a client has asked “How do we compare against our competitors?” or “How are we doing against the benchmark for our industry?” I’d be a rich man. But the thing is that B2B benchmarking is not a good idea.

Seriously. You should strive to be a ‘Unique’ company and not an average company.

Most of our clients want to know how they are doing against the benchmark score for their industry. My response: “If you really aspire to being a mediocre company, then I’ll tell you what the average score is for your industry and how you compare against the average. But you can do better than that. You can be UNIQUE.”

In fairness, some of our clients have latched on to the message that they should ignore the competition. They should focus purely on being indispensable to their existing customers. Still, it’s tempting to see where you stand in a league tables against your industry peers.

So let me ask a few questions about why you want to do benchmarking. Because B2B benchmarking is not a good idea!

What exactly is your industry?

Are you in the insurance industry, or the insurance broking industry? Or are you in both? Or re you an outsourcing company that specialises in insurance third-party processing?

They’re all in the insurance world but these are very different industries. They have different dynamics and there are differences in average scores from one industry to the next. For example, we know from experience that many IT and most BPO (Business Process Outsourcing) companies tend to get lower than average scores, while corporate banking and professional services companies tend to get higher than average scores. Firms operating in niche markets also find it easier to be seen as different and unique.

If I say you’re at the industry benchmark, will you really be happy?

If you aspire to hit the average score for your industry, or your country, you’re setting the bar pretty low. What you’re telling me is that you want to be an average company.

To take my point to its extreme, benchmarking is little more than a recipe for mediocrity.

Do you realise that international benchmarks are inherently flawed?

This is not just because the insurance broking or widget-manufacturing markets in the Netherlands have a completely different structure than they do in Australia. It’s also because Dutch and Australian clients have completely different approaches to the way they answer customer surveys.

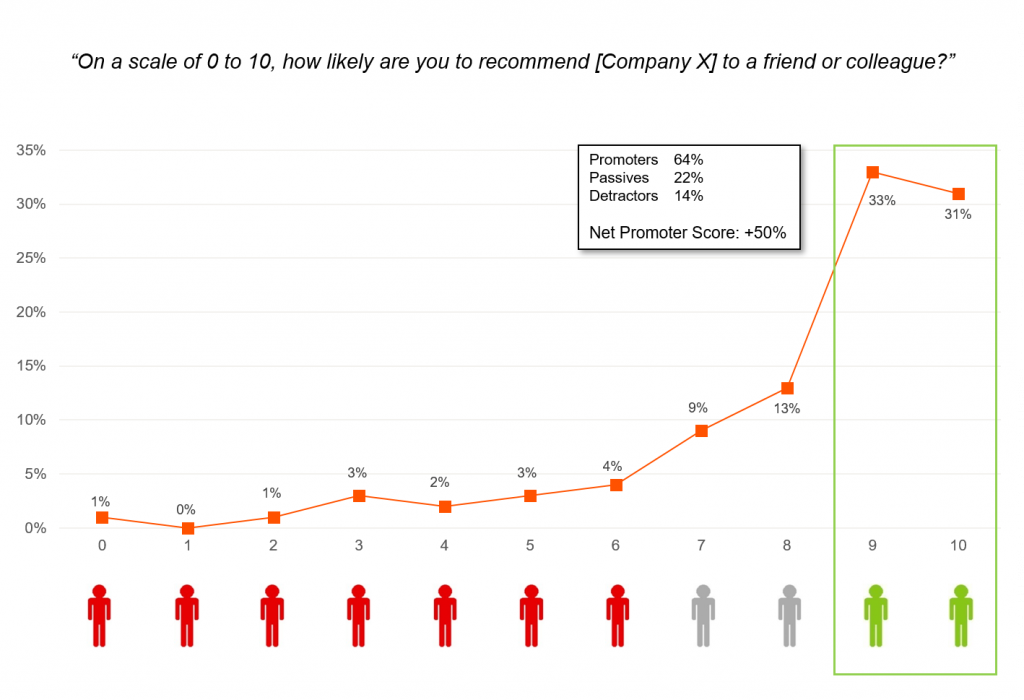
There are some good academic papers on how different nationalities are pre-disposed to answering questionnaires differently. Let me give just one example. Some people will claim that the average Net Promoter Score (NPS) for B2B companies is between 25% and 30%, regardless of industry. However, these figures are heavily skewed towards US companies.

Our experience of gathering NPS scores across 86 different countries since 2006 is that the average NPS score for any B2B industry is closer to 10%. But then again, our clients are more heavily weighted towards European and Australian respondents, who generally tend to score less positively than their American counterparts.

But I still want to benchmark my performance!

I thought you might say that.

If you really do want to benchmark yourself, then let me suggest that you approach the subject of benchmarking in a slightly different fashion:

  1. START BY SETTING THE BAR HIGHER. Aspire to be the best, or at the very least to be ‘Unique’ in the eyes of your customers. Our database at Deep-Insight shows that only 10% of B2B companies are considered Unique by their clients, but these Unique companies have significantly stronger relationships – and retention rates – than the ‘average’ company. Unique companies typically have twice the number of Ambassadors and have NPS scores of 30% or more.
  1. BENCHMARK YOURSELF AGAINST YOUR OWN PERFORMANCE LAST YEAR. That’s a much more reliable way of seeing if you are becoming more customer-centric or not. The journey to becoming a customer-centric organisation is a long one – don’t think you’re going to achieve it in anything less than three years – so be sure to check your progress formally on at least an annual basis.
  1. BENCHMARK YOURSELF INTERNALLY. See what your clients think of you, compared to the scores that are achieved by other divisions or business lines within the same company. If you’re an international company, benchmark yourself against other geographies (but watch out for the cultural differences between, say, American and European divisions.)

Remember that B2B benchmarking is not a good idea. It’s not a BAD idea. It’s just that you should ignore the competition and become unique for your customers.

Good luck!

What is a ‘Good’ Employee Net Promoter Score?

What is a ‘Good’ Employee Net Promoter Score?

Last year, I wrote a blog post entitled What is a ‘Good’ B2B Net Promoter Score?. For some reason it turned out to be surprisingly popular. The blog still gets dozens of hits every week. I’m guessing that was because there’s a lot of nonsense posted on the Internet about companies achieving Net Promoter Score (NPS) results of +62 or even +78, or about people being hugely disappointed because they only achieved a score of +25.

Meanwhile, some of our own clients at Deep-Insight would get upset when I tell them their customer NPS was only marginally positive or – even worse – negative. The two simple messages in that blog post were:

“Be careful about how you interpret NPS figures”

and

“A customer Net Promoter Score of approximately +10 is the average for European B2B firms.”


eNPS versus NPS

In that blog, I was discussing NPS as a measure of customer advocacy. More and more, it is also becoming the de facto standard for measuring employee advocacy and employee engagement. So this blog will address the question: “What is a ‘Good’ Employee Net Promoter Score?”

Before I let you know what that magic number is, it’s worth digressing slightly to explain the basics of how NPS is calculated. If you’re already a net promoter aficionado, skip the box below.

HOW IS THE NET PROMOTER SCORE CALCULATED?

For the uninitiated, a company’s Employee Net Promoter Score (eNPS) is based on the answers its employees give to a single question:

“On a scale of 0 to 10, how likely are you to recommend Company X to a friend or colleague?”

Employees who score 9 or 10 are called ‘Promoters’. Those who score 7 or 8 are ‘Passives’ while any employee who gives a score of 6 or below is a ‘Detractor’. The actual eNPS calculation is:

Net Promoter Score = the percentage of Promoters minus the percentage of Detractors

Theoretically, companies can have a Net Promoter Score ranging from -100 to +100.


So think about it. The only Promoters you have in your company are those employees who are prepared to give you a score of 9 or 10 out of 10. In the average American company (remember that the whole Net Promoter concept originated in the USA) that makes sense. Americans tend to score very positively when they are satisfied, so having a high cut-off point is appropriate. However, if you’ve grown up and live and work in a European country, you approach the Net Promoter question from a very different cultural perspective.

It’s a Cultural Thing

Many – nay, most – Europeans regard 8/10 as a very good score. Some will argue that 9s or 10s are only handed out in exceptional circumstances. This is culturally ingrained into us Europeans through our schooling system and particularly through our university grading system.

Making the Grade
In European universities, a First Class Honours degree requires a score of 70% (7 out of 10). Scores of 75% are remarkable, while scores of 80% (8 out of 10) and higher are almost unheard of. These cultural differences have to be taken into account when interpreting whether a particular Employee Net Promoter Score is ‘good’ or ‘bad’.

The Magic Number

So what is a ‘Good’ Employee Net Promoter Score? We have been measuring NPS and eNPS since 2006. We do this mainly for European and Australian companies. The average Employee Net Promoter Score (eNPS) across all of our clients during that time has been a paltry -10. Yes, that really is a negative sign before the 10.

MINUS TEN!

Put it another way: achieving a positive Employee Net Promoter Score is a solid achievement for most European firms. Rarely do we see eNPS results in excess of +20.

So there you have it. If your company has just received a negative eNPS in the latest employee survey, don’t feel too bad. You’re in good company!
To find out more about Deep-Insight’s employee assessments, click here.
Does NPS Work for B2B Companies

* Net Promoter® and NPS® are registered trademarks and Net Promoter SystemSM and Net Promoter ScoreSM are trademarks of Bain & Company, Satmetrix Systems and Fred Reichheld

What is a Good B2B Net Promoter Score?

U P D A T E : We now have an updated analysis of what a GOOD B2B Net Promoter Score looks like. It’s based on data from 2015 to 2022.

* * * * * * * * * * * * *
So what is a GOOD B2B Net Promoter Score?

It’s a question we get asked a lot. Sometimes the question comes in slightly different formats. For example:

“What Net Promoter Score target should we set for the company?

“+25 seems a bit low, so maybe +50?”

“Or should we push the boat out and aim for +70?”

Well, it depends on a number of different factors. As we mentioned in an earlier blog, it can even depend on factors such as whether your customers are American or European. Seriously, that makes a big difference.

Customer at the Heart

What Factors Impact Your Net Promoter Score?

It’s crucial to understand how these various factors impact your overall Net Promoter Score. Your NPS result can be very sensitive to small changes in individual customer scores. Be aware of these factors when deciding on a realistic NPS figure to aim for. Most Europeans consider a score of 8 out of 10 to be a pretty positive endorsement of any B2B product or service provider. However, in the NPS world, a person who scores you 8 is a ‘Passive’ and therefore gets ignored when calculating the Net Promoter Score (see box below).

HOW IS THE NET PROMOTER SCORE CALCULATED?

For the uninitiated, a company’s Net Promoter Score is based on the answers its customers give to a single question:

“On a scale of 0 to 10, how likely are you to recommend Company X to a friend or colleague?”

Customers who score 9 or 10 are called ‘Promoters’. Those who score 7 or 8 are ‘Passives’ while any customer who gives you a score of 6 or below is a ‘Detractor’.

The actual NPS calculation is:

Net Promoter Score = Percentage of Promoters MINUS the Percentage of Detractors

Theoretically, companies can have a Net Promoter Score ranging from -100 to +100.

Here’s the thing. If you can persuade a few of your better customers to give you 9 instead of 8, then suddenly you’ve boosted your Promoter numbers significantly. We know more than a handful of account managers who carefully explain to their clients that a score of 8 out of 10 is of no value to them. If clients appreciate the service they are getting they really need to score 9 or 10.

Sure, there’s always a little ‘gaming’ that goes on in client feedback programmes, particularly when performance-related bonuses are dependent on the scores. However, we find it intriguing to see the level of ‘client education’ that account managers engage in when the quarterly or annual NPS survey gets sent out!

Five Key Factors

We said at the outset that the Net Promoter Score you achieve is dependent on a number of factors. Here are the five key factors:

1. Which geographical region do your customers come from?

We’ve covered this point in an earlier discussion with Professor Anne-Wil Harzing. American companies generally get higher NPS results than Europeans – typically 10 points higher and often much more.

2. Do you conduct NPS surveys by telephone or face-to-face or by email?

In the UK and Ireland, we don’t like giving bad news – certainly not in a face-to-face (F2F) discussion. Even if we’re talking over the phone, we tend to modify our answers to soften the blow if the feedback is negative. Result: scores are often inflated. In our experience, online assessments give more honest results but can result in scores 10 points (or more) lower than in telephone or F2F surveys. This gap can be smaller in countries like the Netherlands, Germany and Australia where conversations tend to be more robust. It’s a cultural thing.

3. Is the survey confidential?

Back to the point about culture – it’s easier to give honest feedback if you can do so confidentially. This is particularly the case if the customer experience has been negative or if you have a harsh message to deliver. Surveys that are not confidential tend to paint a much rosier picture than those that are confidential.

4. Is there a governance structure in place?

At Deep-Insight, we advocate a census approach when it comes to customer feedback. Every B2B customer above a certain size MUST be included in the assessment. No ifs or buts. Yet we are often amazed by the number of companies that allow exceptions. For example: “We’re at a sensitive stage of our relationship with Client X so we’re not going to include them”. In many cases, it’s more blatant. Clients are excluded because everybody knows they will give poor feedback. A proper governance structure is required to ensure ‘gaming’ is kept to a minimum. This gives the survey process credibility.

5. Is the survey carried out by an independent third party, or is it an in-house survey?

In-house surveys can be cost-effective but suffer from a number of drawbacks. The main drawback is that they generally result in inflated scores. For starters, in-house surveys are rarely confidential and are more prone to ‘gaming’ than surveys run by an independent third party. We have seen cases where in-house surveys have been replaced by external providers and the NPS scores have dropped by a whopping 30 points or more. Seriously, the differences are that significant.

So what is a GOOD NPS score for B2B companies?

Now, let’s get back to the question of what constitutes a good B2B Net Promoter Score. Here’s our take on it.

Despite the claims that one hears at conferences and on the Internet that “we achieved +62 in our last NPS survey”, such scores are rarely if ever achieved. We’ve collected NPS data for B2B clients across 86 different countries since 2006. Our experience is that in a properly-governed independent confidential assessment, a Net Promoter Score of +50 or more is extremely rare. Think about it. To get 50, you need a profile like the one below, where a significant majority of responses are 9 or 10. In Europe, that simply doesn’t happen.

B2B Net Promoter Score
Our experience of B2B assessments is that A NET PROMOTER SCORE OF +30 IS EXCELLENT and generally means you are seen as ‘Unique’ by your customers.

A NET PROMOTER SCORE OF ABOUT +10 IS PAR FOR THE COURSE. Consider +10 to be an average NPS score for a B2B company in the UK or northern Europe.

Note that negative Net Promoter Scores are not unusual. Approximately one third of Deep-Insight’s B2B clients have negative scores. One in 10 has a score of -30 or even lower.

Benchmarking

One final comment about benchmarking. Deep-Insight’s customer base is predominantly northern European or Australian. However, many of our clients operate in eastern or southern Europe – and in Asia or North America. We need to be careful about how we benchmark different divisions within the same company that are in different regions.

In our opinion, the best benchmark – for a company, business unit or division – is last year’s score. If your NPS is higher this year than it was last year, then you’re moving in the right direction. And if your NPS was positive last year, and is even more positive this year, happy days!

* Net Promoter® and NPS® are registered trademarks and Net Promoter SystemSM and Net Promoter ScoreSM are trademarks of Bain & Company, Satmetrix Systems and Fred Reichheld

Do Americans REALLY score more positively than Europeans?

In a previous blog, I wrote that Europeans were more stingy than Americans when it came to customer feedback. Or words to that effect. So do Americans REALLY score more positively than Europeans?


Since then, people have been asking if this is REALLY true. In other words, where is the evidence for this claim?

Well, yes it IS true. While I’m not an expert in the area, I do know somebody who is: Anne-Wil Harzing, Professor of International Management at Middlesex University, London.

In 2006, Professor Anne-Wil Harzing conducted an analysis of different response styles across 26 different countries.

We recently sat down with Anne-Wil Harzing to discuss these differences.


Interview with Anne-Wil Harzing

John: Professor Harzing, if I look at our own clients – which are mainly headquartered in Europe, USA and Australia – their customers can be based anywhere in the world. When we often report results back by country, we often identify differences from country to country in Customer Relationship Quality (CRQ) or Net Promoter Score (NPS). How should we interpret those differences?

Anne-Wil: Good question – let me answer that in two ways. First, there are characteristics at a country level such as power distance, collectivism, uncertainty avoidance and extraversion. These all have a major influence on the way people respond to questionnaires and surveys. This is particularly true when you use Likert scales. You know, the 1-7 scales that you use, or the 0-10 scale that’s used in Net Promoter Score surveys. Second, there are differences based on whether the respondent is replying to a questionnaire in his or her native tongue. Also, English language competence is positively related to extreme response styles and negative related to middle response styles.

John: Can you explain the difference response styles?

Anne-Wil: The main styles that people talk about are Acquiescent Response Style (ARS) and and Extreme Response Style (ERS). ARS is where respondents are more likely to agree or give a positive response to a question. ERS is where the response is more likely to be highly positive or highly negative than Middle Response Style (MRS) where there is a greater tendency to go for an ‘average’ response. High ARS implies better/higher scores. ERS gives you more varied or extreme (and possibly higher) scores than MRS.

John: Can you give us a few examples of those country differences?

Anne-Wil: Sure. Respondents from Spanish-speaking countries show higher ERS and ARS while Japanese and Chinese respondents tend to be far less extreme in their response styles. Across Europe, the Greeks stand out as the highest levels of acquiescence and ERS. Countries across Northern and Western Europe – where many of Deep-Insight’s clients are based – tend to exhibit fairly similar response patterns.

John: And Americans?

Anne-Wil: High ERS and high ARS – you’ll generally get a more positive response from an American audience than from a Western or Northern European audience.

John: That’s very much in line with our own findings. We also see it in a lot of discussions around Net Promoter Scores (NPS). On some American websites, you will read that the average NPS for B2B companies is between 25% and 30%. And yet our experience at Deep-Insight is that the average NPS score is closer to 10%. This may well be related to the fact that the majority of our customers (or more important, their clients) are European or Australian, rather than American.

Anne-Wil: It just goes to show that you need to take great care when interpreting cross-country scores. When people complete a survey, their answers should be based on the substantive meaning of the questions. However, we know that people’s responses are also influenced by their response style, so differences between a company’s geographically-based divisions might simply reflect differences in the way clients respond to surveys, rather than picking up real differences in the ways those divisions are going to market.

Americans v Europeans

So Europeans ARE more stingy than Americans! Or to put it more kindly, Americans REALLY score more positively than Europeans.

Our own research – although more anecdotal than Professor Harzing’s – backs up her results. Apart from the higher NPS scores I mentioned in the discussion, we also see Americans give higher Customer Relationship Quality (CRQ) scores than Europeans. We pick this up on the standard deviation figures from our results as well. This often results in fewer “Rationals” in the customer base of American clients. (Rationals are good, but not extremely loyal, customers who typically make up 50% of a typical customer base.) In contrast, American clients tend to have more “Ambassadors” and sometime more “Opponents”, which reflects the ERS and ARS styles that Professor Harzing describes.

In her paper, Harzing concludes that:

“Regardless of what remedy is used to eliminate or alleviate response bias, the first step towards finding a solution is acknowledging that response bias can be a serious threat to valid comparisons across countries. We hope this article has provided a step in that direction and that in future response bias will receive the attention it deserves from researchers in the area of international and cross cultural management.”

Good advice!


* Net Promoter® and NPS® are registered trademarks and Net Promoter SystemSM and Net Promoter ScoreSM are trademarks of Bain & Company, Satmetrix Systems and Fred Reichheld