Turn Data to Insights
When we created ‘Deep-Dive‘ we wanted to give our clients more freedom to analyse their CRQ and NPS results rather than receiving simple static standard reports. What we discovered was that our ‘Deep-Dive‘ CX platform is critical for helping you understand exactly what your customers are thinking.
.01
Plot your progress
We stack up all the results since we’ve started working together and provide you with wave-on-wave comparison data. Each year you will have more and more data to analyse and to track progress over time. You will be able to see instantly your Customer Relationship Quality (CRQ) and Net Promoter scores and understand how you are positioned in the market against your competitors.
.02
Test for Uniqueness!
Check how far is your company from becoming unique by analysing the Uniqueness chart. You can see where you were positioned in previous years and the progress you’ve made.
.03
Access account reports
You will be able to select key clients and at a click of a button, produce an account report which will tell you exactly what Key Decision Makers, Influencers and Operational Contacts are thinking in that client.
.04
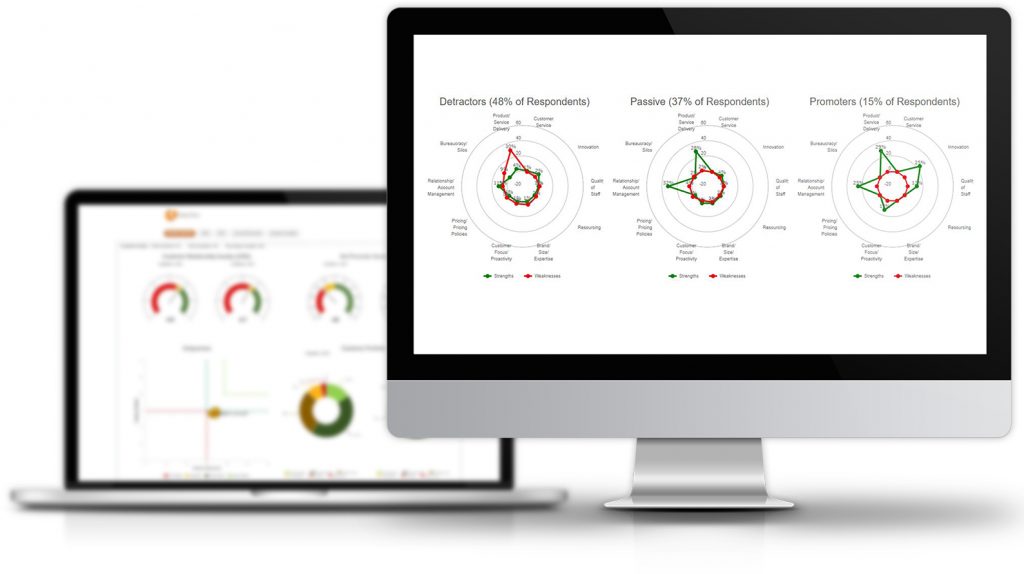
Greatest Strength?
See the greatest strengths and weaknesses of your company through our Comments Analysis graphs. You can analyse these comments by different themes to find out exactly what interventions are required for you to become more customer-centric.
.05
Slice and dice!
You may want to see the results in a certain way. Perhaps for a certain department. Or for a region or country. Use our Dynamic Crosstabs to slice and dice your client feedback, exactly as you need.