NEW Deep-Inside the last 24 months

NEW Deep-Inside the last 24 months

How Deep-Insight is Tranforming CX Delivery

What has changed – and why it matters:
The past 24 months have been a turning point at Deep-Insight. Behind the scenes, we’ve completely rethought the way in which we deliver customer experience (CX) insights to our customers in the B2B space. As a result, we now have a (significantly) faster, more agile and more intelligent approach to enable you to understand your customers.
In 2024, we decided to re-establish the Product Management role within our organisation as a core strategic function. This was not just an internal shift, it was done as a direct response to a crystal clear message that we received from our clients:
Act faster to deliver even sharper insights.
Our customer’s feedback: the driving force behind our transformation
We’ve used your feedback as a driving force for all the changes we’ve made recently. Over the past 1-2 years we have worked closely with B2B leaders and conducted a series of in-depth interviews to really understand how they envision the customer experience landscape changing in the future. Our findings were consistent:
    • Businesses need real-time, actionable CX insights
    • Agility is no longer optional, but critical
    • Legacy tools are holding teams back
We took this feedback and advice seriously – and we acted on it.
What we’ve improved: CX platform innovations
As a result of everything we learned, we decided to first review the technical capabilities of the tools we were using. We wanted to relay the foundation on which we run our programmes and such we implemented the following:
  1. A faster, more intuitive survey experience, providing respondents with:
    • A clean, modern interface
    • Simplified navigation between questions
    • Faster overall response time
The result? The same reliable customer feedback data but delivered with less friction.
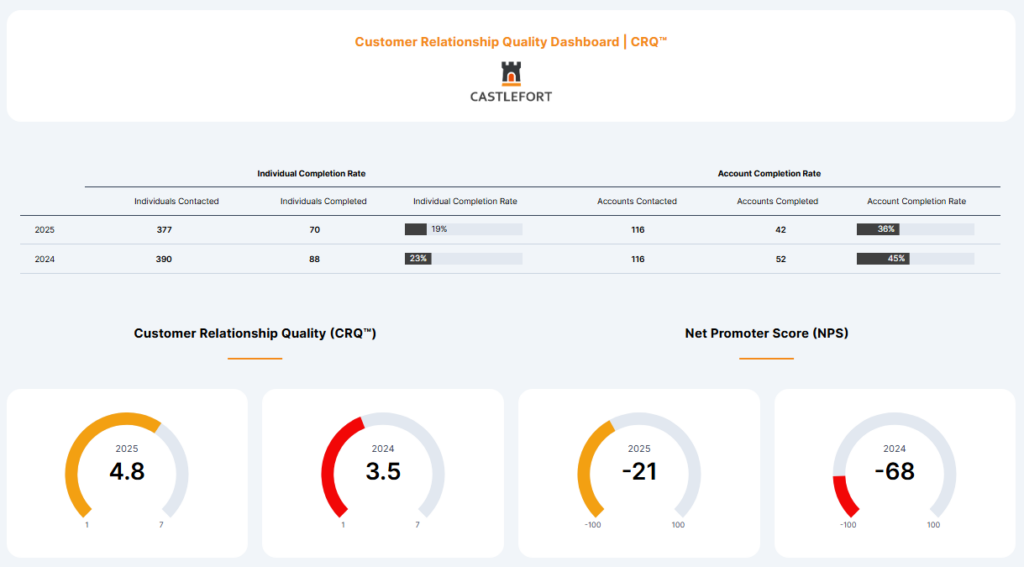
 

  1. The introduction of Deep-Dive Studio – our new CX analytics platform
This has to be the biggest leap forward that we’ve taken in years. This powerful analytical dashboard is specifically designed for understanding B2B customer experience insights. With this new platform, we have unlocked:
    • Real-time access to completion rates during the live survey period
    • Faster, flexible insight generation
    • Advanced analysis for in-depth understanding
    • AI-powered sentiment analysis
It helps us and our customers with actionable outputs for both account level changes as well as driving organisational strategy. In short, it transforms raw data into decision-ready intelligence.
  1. Greater flexibility and customisation for complex B2B environments
No two B2B organisations are the same, and your CX tools shouldn’t be either. In the past, we used rigid tools, but that period has come to an end. Our new technology allows us to:
    • Adapt to bespoke client requests
    • Go beyond our standard frameworks
    • Respond quickly to the evolving market conditions
All in all, this means that you get a CX programme tailored to your business, not a one-size-fits-all model.
Why this matters for CX leaders
If you are responsible for CX in a B2B environment, you are likely feeling an ever-increasing pressure to:
    • Demonstrate return on investment (ROI) from CX
    • Deliver insights faster
    • Ensure feedback is aligned with strategic decisions
We have designed our transformation with this in mind and can help you from moving from data collection into driving real impactful change.
What’s next?
This is just the beginning. Our product team is committed to continuous improvement – testing, learning and evolving alongside our clients. You can expect further innovation as we continue on this journey to push the boundaries of what is possible at Deep-Insight when it comes to B2B customer experience management.
Get involved in our journey
If you’d like to:
    • See our new CX tools in action
    • Explore how CRQ and Deep-Dive Studio can support your business
    • Share your own ideas or challenges
We’d love to hear from you – your inputs fuel our progress.
Get in touch for a demo or a conversation about your CX goals—and let’s shape the future of B2B customer experience together.
Fabienne Falvay
Product Manager

What is a good e-NPS score?

What is a good e-NPS score?

What is a ‘Good’ Employee Net Promoter Score?

Last year, I wrote a blog post entitled What is a ‘Good’ B2B Net Promoter Score?. For some reason it turned out to be surprisingly popular. The blog still gets dozens of hits every week. I’m guessing that was because there’s a lot of nonsense posted on the Internet about companies achieving Net Promoter Score (NPS) results of +62 or even +78, or about people being hugely disappointed because they only achieved a score of +25.
 
Meanwhile, some of our own clients at Deep-Insight would get upset when I tell them their customer NPS was only marginally positive or – even worse – negative. The two simple messages in that blog post were:


“Be careful about how you interpret NPS figures”
and
“A customer Net Promoter Score of approximately +10 is the average for European B2B firms.”

eNPS versus NPS

In that blog, I was discussing NPS as a measure of customer advocacy. More and more, it is also becoming the de facto standard for measuring employee advocacy and employee engagement. So this blog will address the question: “What is a ‘Good’ Employee Net Promoter Score?”


Before I let you know what that magic number is, it’s worth digressing slightly to explain the basics of how NPS is calculated. If you’re already a net promoter aficionado, skip the box below.
HOW IS THE NET PROMOTER SCORE CALCULATED?
 
For the uninitiated, a company’s Employee Net Promoter Score (eNPS) is based on the answers its employees give to a single question:
“On a scale of 0 to 10, how likely are you to recommend Company X to a friend or colleague?”
Employees who score 9 or 10 are called ‘Promoters’. Those who score 7 or 8 are ‘Passives’ while any employee who gives a score of 6 or below is a ‘Detractor’. The actual eNPS calculation is:
Net Promoter Score = the percentage of Promoters minus the percentage of Detractors
Theoretically, companies can have a Net Promoter Score ranging from -100 to +100.
alessandro-bianchi-_kdTyfnUFAc-unsplash
So think about it. The only Promoters you have in your company are those employees who are prepared to give you a score of 9 or 10 out of 10. In the average American company (remember that the whole Net Promoter concept originated in the USA) that makes sense. Americans tend to score very positively when they are satisfied, so having a high cut-off point is appropriate. However, if you’ve grown up and live and work in a European country, you approach the Net Promoter question from a very different cultural perspective.

It's a Cultural thing

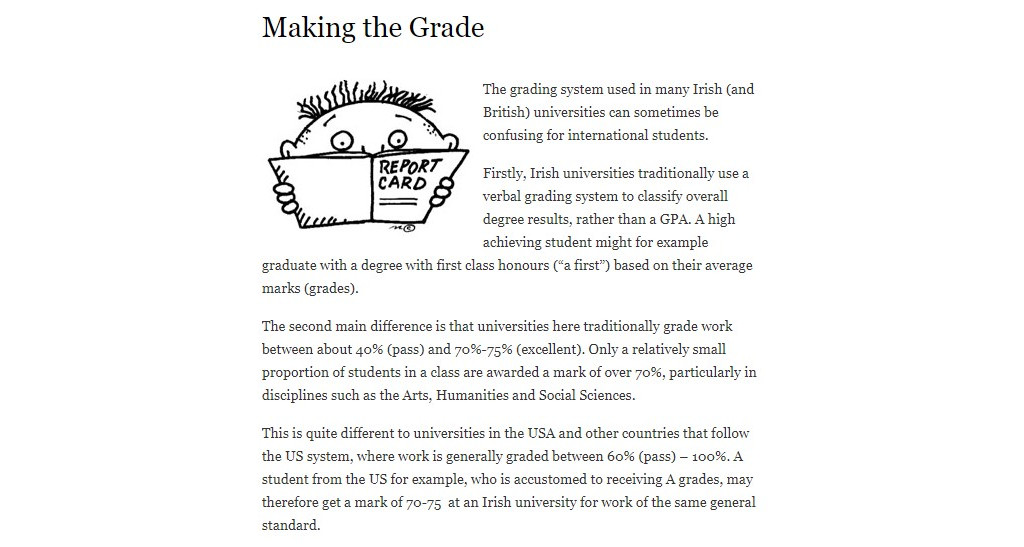
Many – nay, most – Europeans regard 8/10 as a very good score. Some will argue that 9s or 10s are only handed out in exceptional circumstances. This is culturally ingrained into us Europeans through our schooling system and particularly through our university grading system.
Making the Grade
In European universities, a First Class Honours degree requires a score of 70% (7 out of 10). Scores of 75% are remarkable, while scores of 80% (8 out of 10) and higher are almost unheard of. These cultural differences have to be taken into account when interpreting whether a particular Employee Net Promoter Score is ‘good’ or ‘bad’.

The Magic Number

So what is a ‘Good’ Employee Net Promoter Score? We have been measuring NPS and eNPS since 2006. We do this mainly for European and Australian companies. The average Employee Net Promoter Score (eNPS) across all of our clients during that time has been a paltry -10. Yes, that really is a negative sign before the 10.

MINUS TEN!

Put it another way: achieving a positive Employee Net Promoter Score is a solid achievement for most European firms. Rarely do we see eNPS results in excess of +20.
So there you have it. If your company has just received a negative eNPS in the latest employee survey, don’t feel too bad. You’re in good company!
To find out more about Deep-Insight’s employee assessments, click here.
* Net Promoter® and NPS® are registered trademarks and Net Promoter SystemSM and Net Promoter ScoreSM are trademarks of Bain & Company, Satmetrix Systems and Fred Reichheld