Should Customer Experience and NPS Surveys be Anonymous?

CX and NPS feedback – should it be anonymous?

Should Customer Experience and NPS Surveys be Anonymous? The simple answer is NO – anonymity is not required for a B2B CX or NPS programme.

But the answer is not that simple. Let’s start by defining what Confidential and Anonymous mean in the context of surveys. This may sound obvious, but I have been amazed at the number of times I have needed to discuss this:

ANONYMOUS: No person or application can associate the answers you give with any identifiable information about you
CONFIDENTIAL: Any identifiable information about you will be held confidentially, and stored in an appropriately secure manner
OPTIONAL CONFIDENTIALITY: Any identifiable information about you will be held confidentially, and stored in an appropriately secure manner unless you specify that you would like to be identified (in other words, you decide to waive your right to confidentiality)

So for the rest of this blog, I am not longer going to dwell on anonymity. It’s simply not needed.

Confidentiality – now that’s a different matter

In any setting, when a third party asks for your opinion about someone, confidentiality is important to ensure a really open and honest response. In personal relationships this goes without saying but in the B2B world this is also true. It’s especially true if your staff are doing what you need them to be doing – building strong and personal relationships with clients.

Of course, many of your customers will indeed give you an honest response regardless of whether it is confidential or not. But many won’t. Cultural differences will mean this statement is truer in some parts of the world than others. However, regardless of where your customers live, there will always be those who will not respond, or who may not be as open as you would like them to be, unless their responses remain confidential.

Example 1

This example is an actual Deep-Insight client.

Company A ran a Customer Relationship Quality (CRQ) assessment (Survey 1) and told respondents that they had the option for their responses to remain confidential. Six months later Company A ran the survey again, but this time told respondents the option to remain confidential was removed.

The impact on their average Net Promoter Scores (remember NPS is a measure of advocacy on a 0 to 10 scale) was as follows:

Individuals’ responses in Survey 1 Completion Rate (Survey 2) Average NPS (Survey 1) Average NPS (Survey 2)
Chose confidentiality (did not share details) 55% 6.3 7.5
Waived confidentiality (shared details) 70% 7.1 7.2


For respondents who had shared their names with their responses in Survey 1, there was no significant impact. When asked to complete Survey 2, 70% did complete and only a small uptick in scores was noted (7.1 to 7.2).

However, where respondents chose to keep their feedback confidential in Survey 1, there was a much bigger impact. For starters, only 55% of these individuals chose to complete Survey 2. For those who completed Survey 2, there was also a significant increase in scores (from 6.3 to 7.5). In fact, ‘Confidential’ respondents went from scoring more poorly than average to scoring more positively than average when forced to share their details with the response.

Example 2

Here’s another client of ours. Having received very high scores for several consecutive surveys, Company B decided to introduce the option of confidentiality to ensure the integrity of what it was measuring. The findings were interesting, especially for newly-included respondents:

  • 26% of respondents opted to remain confidential overall but for newly-included respondents the figure was 38%
  • ‘Confidential’ respondents scored more poorly than those who agreed to share their responses – but not significantly so
  • Newly-included respondents who opted for confidentiality scored significantly more poorly than other respondents


“…but my teams are frustrated by these unactionable ‘Confidential’ responses”

In both examples above, the organisations had good business reasons when they chose not to include confidentiality in their CX process:

  • Improved usefulness as an account management tool as ALL feedback is provided to account management teams
  • All raw data can be fully integrated with internal systems, allowing ongoing re-segmentation of responses (this is limited when responses are confidential)

But the argument that your CX or NPS programme should include ‘Optional Confidentiality’ is far stronger. If you don’t include optional confidentiality, your most unhappy customers will either not respond or will not give you a completely honest response.

This puts your entire CX or NPS programme at risk. You will end up making decisions based on inaccurate or incomplete data.

So should NPS Surveys be Anonymous? No. Should they include ‘Optional Confidentiality’? Absolutely!

“Is there any way to convince ‘Confidential’ respondents to share their details but still give an honest response?”

Maybe, but this will take time; people are people after all.

If a customer is at a point in their journey with you that they do not want to share their details, but they are willing to give feedback, that’s OK. Of course, you can explain the benefits of what you can do if they agree to share their details with you (you can address their issues more easily) but don’t push too hard. There is a trust issue here. Pushing won’t help.

You have a much better chance of convincing this customer by including them in your ‘Close the Loop’ process even though you don’t have a response from them. Over time you will gain their trust, both in the CX or NPS programme as well as in your organisation. You’ll eventually win that shared response.

Limerick’s Net Promoter score is only +7

This is a theme I’ve explored a few times in the past: the NPS results for sports teams.

Despite an imperious performance by the Shannonsiders in last weekend’s All-Ireland Hurling Final, Limerick’s Net Promoter score is only +7.

The Greatest Final in Modern Times?

On Sunday, we witnessed one of the greatest hurling matches of the modern era. Hurling, you ask? A game played with sticks and a small hard ball called a sliotar. The greatest, fastest, most skillful game in the world. It truly is.

I should declare an allegiance here. Even though Deep-Insight is headquartered in Cork, I was born in Limerick. Although I didn’t live in the county for very long, I do support the Shannonsiders whenever it gets to the business end of an All-Ireland Hurling championship.

Last Sunday was All-Ireland Final day and it was a contest between the two best teams in the country: Limerick and Cork. It turned out to be a game of men against minnows as Limerick bullied and outplayed Cork into submission in an enthralling display of hurling. The final score: Limerick 3-32 to Cork’s 1-22.

Limerick Player Ratings

Here’s Paul Keane’s full list of Limerick player ratings from this week’s Irish Examiner:

Nickie Quaid: Not much he could do about Shane Kingston’s early bullet that flew past him to the net. Kept a clean sheet thereafter and mixed up his puck-outs well, going short when the opportunities were there. 8 (‘Passive’ score in NPS terminology)

Sean Finn: Beaten by Shane Kingston for the Cork goal. Started on Jack O’Connor though switched over to Patrick Horgan for a period. Horgan took him for two points from play but both were serious efforts from the Cork captain. 8 (Passive)

Dan Morrissey: Expected to pick up Patrick Horgan and did so for the most part, holding the prolific forward scoreless from play in that time. Locked down a mean defence that had to deal with an early Cork whirlwind. 8 (Passive)

Barry Nash: Punched the air in delight after closing out the first-half scoring with a long-range point. Still there at the death, attempting to tag on one last score for the Shannonsiders. 8 (Passive)

Diarmaid Byrnes: At his very best again. It was Byrnes’ precise pass that created Aaron Gillane’s goal and he split the posts for a trademark long-range point approaching half-time. Denied Seamus Harnedy a goal with a 64th-minute block. 8 (Passive)

Declan Hannon: Another textbook display at the centre of the Limerick defence. Used all his leadership to nail the quarterback role. Helped get Limerick going with an early point from distance and finished with 0-2. Hobbled off to a huge ovation late on. 8 (Passive)

Kyle Hayes: None of the drama of the Munster final when he scored the goal of the season but still worked tirelessly, winning frees and shooting for points long after the result was beyond doubt. 7 (Passive)

William O’Donoghue: A big part of why Limerick got on top in the middle third. Emptied his tank and strung together the play intelligently. 7 (Passive)

Darragh O’Donovan: On point and crisp at midfield, delivering accurate passes throughout and thundering through the exchanges. One of 13 different Limerick players to get on the scoresheet on the day. 8 (Passive)

Gearóid Hegarty: A huge performance from the reigning Hurler of the Year. Clipped 2-2 and struck two wides in the first half alone as he opened up with some spectacular hurling. Eventually replaced to huge cheers. 8 (Passive)

Cian Lynch: Pointed after 11 seconds and never let up, setting up both of Gearóid Hegarty’s goals. Toyed with the Cork defence at times, finishing with six points from play. His interception and flick up for Tom Morrissey’s 18th-minute point was outrageous. 9 (Promoter)

Tom Morrissey: Mixed silk with steel, showing an awesome work rate but also an ability to pick off a series of deft passes that led to important scores. Weighed in with three points from play himself on another landmark day. 8 (Passive)

Aaron Gillane: Hard to believe now he didn’t start the Munster final. Looked like a player keen to prove a point and was on fire throughout, finishing with the first-half with 1-3 and adding another three points for a 1-6 haul. 8 (Passive)

Seamus Flanagan: Helped put the game beyond Cork during Limerick’s early blitzkrieg, pointing sumptuously in the eighth minute and passing to Aaron Gillane for the second goal. Scored just a point but set up so much more. 8 (Passive)

Peter Casey: A bittersweet afternoon for the Na Piarsaigh man. Clear to play after his red card in the semi-final and on fire for 30 minutes, shooting 0-5 from play. Then crumpled with a left knee injury and had to come off. 8 (Passive)


Limerick’s Net Promoter score is only +7

The best ranking player was Cian Lynch who strode the field like a Colossus but who was the only player to get 9/10 from the Irish Examiner correspondent.

15 players and only one achieved a score consistent with a ‘Promoter’ ranking of 9 or 10; Everybody else was a Passive, in a match where Limerick utterly dominated their Munster rivals and played one of the most memorable matches in living memory.

Net Promoter Score = % of Promoters (7%) less % of Detractors (0%), hence a Net Promoter Score of +7.

Benchmarking

I have written before about how benchmarking needs to be conducted carefully when you compare scores from customers in different countries.

I have also written about how people in different countries are culturally programmed to score in particular ways. The most obvious example is that Americans are more prone to score more positively than Europeans if they receive a good service.

This is an important point to remember if you are running a Customer Experience (CX) programme across a global client base. An average Net Promoter score for Northern European B2B companies is no higher than +10. For American companies, it’s more like +20 or +30, a score that would be regarded as ‘excellent’ in a Northern European context.

So be careful when comparing NPS results across different jurisdictions. If it helps, just remember that Limerick’s Net Promoter score is only +7 in a year where they dominated the All-Ireland hurling final!

UPDATE (17 July 2022 All-Ireland Final)

Yesterday, Limerick won the All-Ireland Hurling Final again. This time they defeated Kilkenny in another enthralling battle that ended 1-31 to 2-26.

Sadly, their Net Promoter Score was -13. Yes, MINUS 13, according to Conor McKeon of The Independent:

Nickie Quaid – 7
Seán Finn – 7
Mike Casey – 7
Barry Nash – 8
Diarmaid Byrnes – 9
Declan Hannon – 8
Dan Morrissey – 6
Wiliam O’Donoghue – 6
Darragh O’Donovan – 6
Gearóid Hegarty – 9
Kyle Hayes – 8
Tom Morrissey – 8
Aaron Gillane – 7
Séamus Flanagan – 7
Graeme Mulcahy – 5


Liverpool F.C. has a Net Promoter Score of -45

When will Liverpool win the Premiership?

It’s still January but Liverpool are already 16 points ahead of the chasing pack in the English Premier League. This been a phenomenal season for Jürgen Klopp’s team so far: 21 wins out of 22 games. No defeats. They even have a game in hand over their nearest rivals Manchester City and the club’s position look unassailable. So it might seem a little strange to claim that Liverpool’s NPS is -45%. Yes, that’s a Net Promoter Score of MINUS 45. It’s true. Sort of.

Liverpool have been English champions 18 times but have never won the Premiership. The last time they won was way back in 1990 when the old First Division had a lot more teams than it does today. Three decades on, the discussion is not around whether Liverpool can win the Premiership this season.

The question being posed is when? And with how many games to spare?

And yet, Liverpool’s NPS score is -45%.

Honestly, it really is Minus 45. Well, sort of.

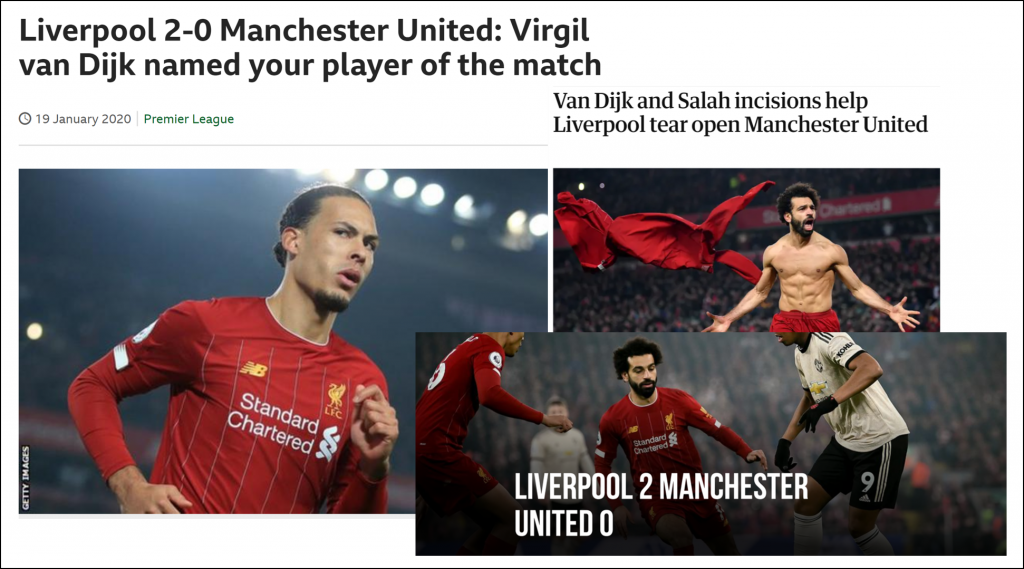
Liverpool 2 – 0 Manchester United

Last weekend, Liverpool beat Manchester United 2-0 in a game that was far more one-sided that the final scoreline suggested.

Liverpool's NPS is -45%

Dave Hytner of the Guardian was in no doubt about the emphatic nature of the victory:

“This was a game in which Liverpool’s superiority was so pronounced for most of the first half and the early part of the second it would have been no surprise had they led by five or six. The intensity of their football coupled with the surgical nature of their incisions were enough to take the breath.”

Now here’s the interesting thing, and the central point of this blog.

Given the imperious nature of Liverpool’s victory over Manchester United, one might think the Guardian would give all the Liverpool players ratings of 9/10 or 10/10 for their performances. Absolutely not. In the UK – in fact, all across Northern Europe – we just don’t do that. It’s not in our nature. Our internal scoring mechanism doesn’t allow it. We are conditioned to reserve 10/10 ratings for performances in the Superhero category. Excellence just gets you 8/10.

So if we were to apply a Net Promoter Score-type rating to the Liverpool team after last weekend’s defeat of Manchester United, the Liverpool team would have received a NPS score of -45 according to John Brewin of the Guardian.

Liverpool Player Ratings

Here’s John Brewin’s full list of Liverpool player ratings:

Alisson: A watching brief for much of the first half, busier but never truly troubled in the second
6 (Remember that 6/10 is a ‘Detractor’ in NPS terminology)

Trent Alexander-Arnold: Prevented from getting forward as often as he likes to, usually by United’s split-striker tactics
6 (Detractor)

Joe Gomez: Another solid performance as the junior but now regular central defensive partner to Van Dijk
7 (7/10 and 8/10 are ‘Passive’ scores in NPS terminology)

Virgil van Dijk: Headed in an opener against the early run of play, and marshalled the backline in style
7 (Passive)

Andy Robertson: His usual influence was muted in the first half before normal service resumed after the break
6 (Detractor)

Alex Oxlade-Chamberlain: Something of a passenger in first half, his substitution was little surprise
5 (Detractor)

Jordan Henderson: His energy kept his team driving forward, hit the post early in the second half
8 (Passive)

Georginio Wijnaldum: Had a goal disallowed for offside and his darts from deep wreaked havoc on United
7 (Passive)

Mohamed Salah: Missed a golden chance in the 48th minute then broke United duck in added time
7 (Passive)

Roberto Firmino: Had a goal disallowed by VAR, and he is still yet to score a goal at Anfield this season
7 (Passive)

Sadio Mané: His best chance, just before half-time, was well saved by De Gea. Otherwise unusually quiet
6 (Detractor)


Liverpool’s NPS is -45%

The best ranking went to Jordan Henderson who only managed to get 8/10 from the Guardian correspondent. Even goal scorers Virgil van Dijk and Mo Salah could only manage a paltry 7 out of 10.

11 Players; None achieved a score consistent with a ‘Promoter’ ranking of 9 or 10s; Six Passives (scores of 7 or 8) ; Five Detractors (scores of 6 or below).

Net Promoter Score = % of Promoters (0%) less % of Detractors (45%), hence a Net Promoter Score of -45.

Cultural Differences from Country to Country

I have written before about how benchmarking needs to be conducted carefully when you compare scores from customers in different countries.

I have also written about how people in different countries are culturally programmed to score in particular ways. The most obvious example is that Americans are more prone to score more positively than Europeans if they receive a good service.

This is an important point to remember if you are running a Customer Experience (CX) programme across a global client base. An average NPS score for Northern European B2B customers is no higher than +10. For American customers, it’s more like +20 or +30, a score that would be seen as ‘excellent’ in a Northern European context.

So be careful when comparing NPS scores across different jurisdictions. If it helps, just remember that Liverpool’s NPS was -45% in a year where they ran away with the Premiership title!

UPDATE (2 February 2020)

I am happy to say that following their 4-0 demolition of Southampton yesterday, Liverpool’s NPS score has improved to -9 (MINUS 9).

Alisson – 7 (out of 10)
Trent Alexander-Arnold – 6
Joe Gomez – 6
Virgil van Dijk – 7
Andy Robertson – 7
Fabinho – 7
Jordan Henderson – 8
Georginio Wijnaldum – 6
Mohamed Salah – 9
Roberto Firmino – 8
Alex Oxlade-Chamberlain – 9 (Man of the Match)


Does your Net Promoter Score (NPS) matter?

DOES YOUR NET PROMOTER SCORE (NPS) REALLY MATTER?

To answer this it is important to really understand what we asking our customers when we use NPS.

Recently, after a perfectly OK meal in a restaurant, someone asked me this question: Would I recommend the restaurant to friends or family? Without hesitation, I said ‘NO’. Queue shock and gasps. The meal was ok, the service was fine, the atmosphere was nice. How could I be so mean? I didn’t think I was being mean. It was all fine but a recommendation from me is a reflection on me, it is saying something about me and my standards – for food of all things. I certainly wouldn’t recommend a food experience that was a bit, well, “meh”.

In the professional B2B world the stakes are a lot higher. Social media – yes that includes LinkedIn – has created a whole business out of self-promotion. Recommending or promoting someone else’s business is an easy way to do this with little effort. It is the ultimate win/win. A recommendation from a customer is the most effective sales tool you can have and in turn, the recommender gets to add value to their brand. But this delicate equilibrium can only exist if your customers trust that recommending your business, and your company’s hard work, will reflect well on them.

So, how do you find out if your customers trust you enough to recommend you? Enter Net Promoter Score or NPS. A clever, albeit obvious, idea –ask them!

And we have been asking, NPS is everywhere and we are obsessed. It can influence the whole mood of an organisation. But can you confidently say that that all of your promoters really are recommending your company? Not until you answer at least the following questions:

Are your Senior Leaders driving a culture of valuing the feedback, not the score?

We are often asked: ‘Do you measure NPS? Head Office needs us to provide an NPS number’.

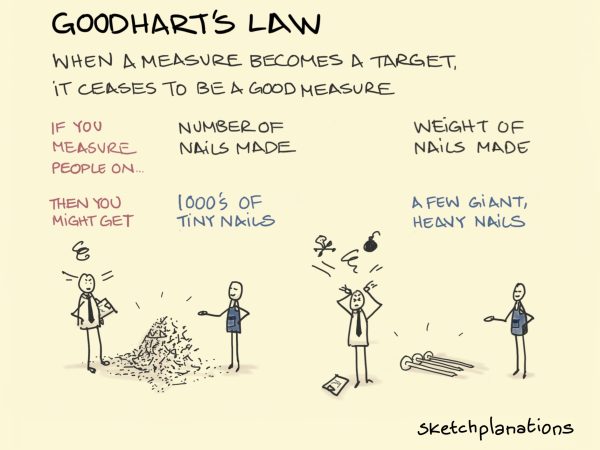
One does not need a doctorate in psychology to know that if there is motivation, implied gain or actual gain, to reach a target number, then that will drive certain behaviors to reach that number. A commitment to consistently gathering the data with integrity needs to come from the leadership team, visibly and regularly. Helping our clients get this engagement from their leadership team is the first thing we do in any CX project, see how we do it here.

Is your organisation measuring it with integrity, or are you chasing a number?

Teams are often trained to find clever ways of making sure that NPS moves in the right direction. A new and improved NPS score is then announced and celebrated. NPS is very useful but only if the culture and approach for gathering it ensure that it is done with the intention of really understand the customer. It’s crucial that organisations do not distract by chasing and competing for a number. This is about the customer after all.

Is Transactional NPS concealing the truth?

Yes, in the last 5 minutes I had a great experience with your customer service team member. But will I recommend your business just based on this? No, of course not. But I will answer 10 because I am a nice person and I don’t want the individual who just really helped me to suffer. This use of NPS is manipulative and gives you absolutely no insight into your customers’ intentions for recommending you.

So, does your NPS score matter?

Does it reflect if your customers are actually recommending you in the marketplace, or has your organisation become better at understanding how and when to gather the responses in order to ensure a score is achieved?

Only when you can answer that should anyone care what the score is.

Does NPS Work for B2B Companies
* Net Promoter® and NPS® are registered trademarks and Net Promoter SystemSM and Net Promoter ScoreSM are trademarks of Bain & Company, Satmetrix Systems and Fred Reichheld

How to Maximise Completion Rates for a CX Programme?

Setting up and running B2B Customer Experience (CX) programmes is our ‘bread and butter’ at Deep-Insight.

We’re used to handling questions on how to make CX programmes more effective. One of the most common questions we get from first-time clients is: “What completion rates can I expect from my CX programme?” Another common question from longer-term clients is “How do I improve my completion rates?”

Let’s deal with each question in turn.
 

“What Completion Rates can I expect from my CX programme?”

Let me preface this by saying that we are talking about business-to-business (B2B) relationships so there is an inherent assumption in the question that our clients have some existing – and hopefully strong – relationships with their customers and that these contacts will be receptive to a request to give feedback as part of that ongoing relationship.

This is usually the case but clients – particularly senior clients – are busy people so it may not come as a surprise to hear that the average participation rate in a B2B customer assessment is around 35%.

But that 35% figure is an aggregate score and there’s a little more to it than that, if you have a look at the graph below.

completion rates CX Programme
 

The spread is wide.

The most common completion rate is in the 26-30% range. We have a smaller number of clients – typically those who have been running our Customer Relationship Quality (CRQ) assessments for many years – who regularly achieve completion rates of 50% and higher.

If this is your first time running a customer assessment – either a simple Net Promoter Score survey of something a little more complex like our CRQ relationship assessments – you can expect completion rates of less than 1 in 3.

This may sound OK if you regularly run consumer surveys where a 5% completion rate can be a good result, but for an existing long-standing B2B client relationship, it’s paltry. And yet we have been running customer assessments of all sorts for nearly 20 years and these are the actual numbers.

So now let’s get to the second question:
 

“How do I improve my completion rates?”

The starting point is to understand why some B2B companies sometimes get really low completion rates and others consistently exceed 50%.

Our lowest-ever completion rate (4%) came from a first-time UK software client. The quality of contact data was simply terrible. We should have spotted that it was little more than a ‘data dump’ from the company’s CRM system. The list included people who had left their companies three years earlier. It included people who had never even heard of our client. It probably included the names of people who were dead. That’s because there was no governance in place for the programme. The Sales Director was not involved. Account Managers did not personally sign off the client contact names. You get the picture.

Our highest-ever completion rate came from a company that has been a client of Deep-Insight’s for 10 years and whose customers view the annual CRQ assessment as a critical part of their ongoing strategic partnership.

But there are other reasons for low and high participation rates. Here’s a quick summary of the profiles of our clients that fit into both categories:

completion rates CX Programme
 

6 Steps to Improve your Completion Rates

Here are the steps you need to take to get your completion rates up:

  1. Make It Strategic. If the CX programme is CEO-led and driven from the top, it will not be seen as another box-ticking exercise. Make sure this is a key item on the Executive agenda.
  2. Put in Governance Structures. By this we mean things like: a) Account Directors should supervise and sign all contact names, not just pull them from the CRM system; b) the Sales Director should personally sign off all Strategic Client contact names.
  3. Don’t call it a Survey! At Deep-Insight, we ban the use of the term “survey” . For us, a CRQ assessment is a strategic ongoing conversation with the clients and their views will be taken seriously.
  4. “Warm Up” the Contacts. An invitation to complete a survey should not come out of the blue. Ideally, it should be introduced by letter or by email by the CEO or Country Manager, and while an assessment is “live”, the account manager will know to stay in touch with the client and urge them to complete the assessment.
  5. Close the Loop. This is critical. If you ask for feedback, you need to share that feedback with the client, agree the actions that BOTH PARTIES will take to improve the relationship.
  6. Repeat. Get into a rhythm where your clients and your sales/account teams know that every February or October (or whenever), the annual strategic assessment will take place. You may want to run frequent assessments. Some companies have quarterly Net Promoter or Pulse assessments – but don’t overdo the frequency. Your organisation needs time to put remedial actions into effect.


Completion Rates of 90% or more?

Follow the above steps and you’ll get your completion rates to 50% or higher.

But remember that these completion rates are at an individual level. You should be getting feedback from multiple people at different levels within each client. Include Influencers and Operational Contacts as well as Key Decision Makers. That way you’ll get a wealth of information about what your key accounts REALLY think of you.

You’ll also get completion rates of 90% at an account level if you take this approach.

If you are interested in reading more about running a CX programme effectively take a look at our process for running a B2B CX assessment or just get in touch with us today for a chat.


Does NPS Work for B2B Companies