We want to extend our deepest gratitude to all our clients who took the time to complete our CRQ assessment this year. Your participation provided us with invaluable feedback.
We are truly humbled and thrilled by the positive scores and detailed responses you’ve given us. Thank you once again for your continued trust and partnership!
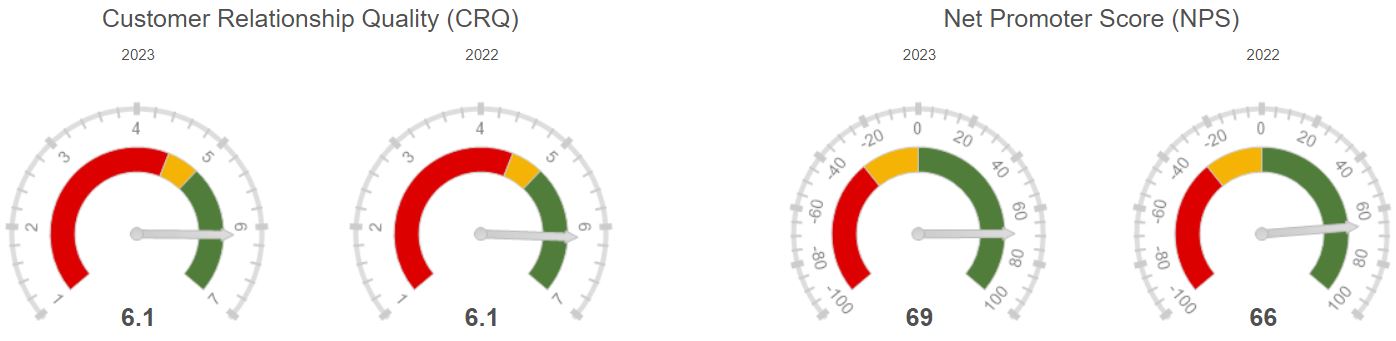
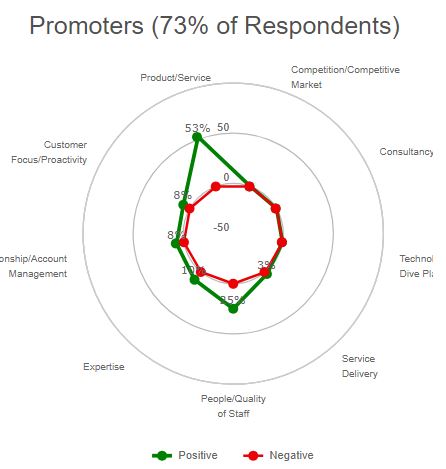
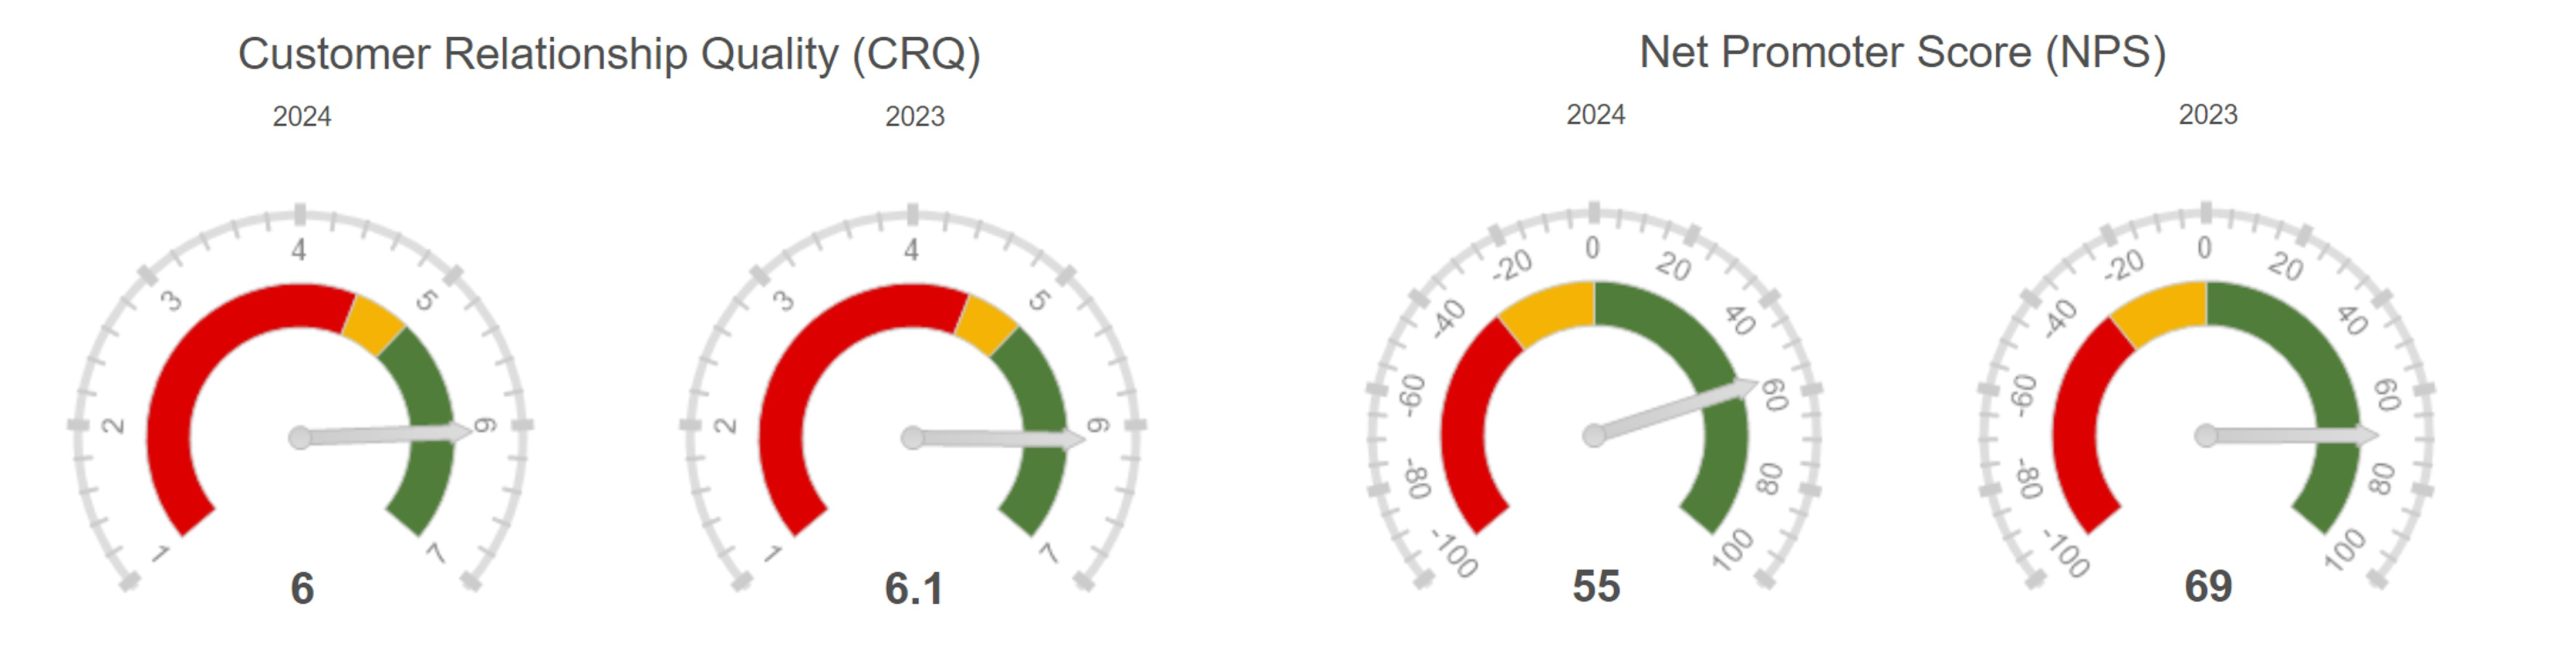
In summary: we received feedback from 85% of our customers, who gave us a CRQ score of 6.0 and a Net Promoter Score of +55.
We are incredibly proud of these scores and all the positive messages we received about our team.
Our greatest strengths are our exceptional team members
and their remarkable skills in forging enduring relationships
as CX consultants with our clients. Their dedication and expertise
truly set us apart. Big thanks to Fabienne Falvay, Kate Casey,
Fiona Lynch and Jade Flynn!
Our Commitment to Continuous Improvement
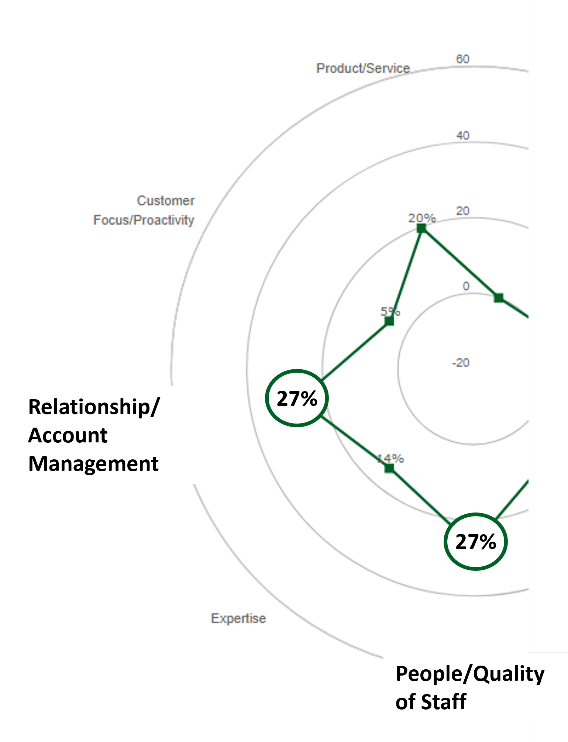
While we received a lot of positive feedback on our Products/Services, we are currently on a journey to explore how we can enhance our services and offerings. Navigating this change journey is a complex but rewarding endeavour.
We’re dedicated to discovering new opportunities for improvement and are eager to learn how we can better serve our customers.
How are we planning to do so?
‘Closing the Loop’ with our own clients.
The feedback process is not finished yet. We need to ‘close the loop’ with all clients and discuss their specific feedback. We will be in touch shortly with each one of our clients. We will be asking for time to discuss each client’s specific results and feedback.
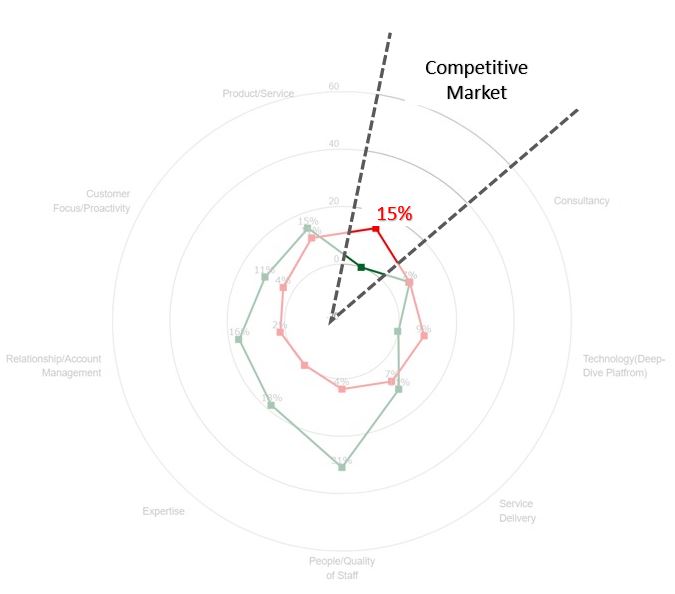
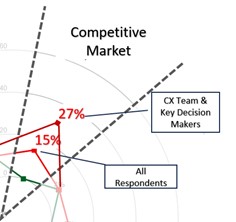
Increase CRQ impact
Our customers appreciate the work we do, but they also see opportunities for CRQ to make an even greater impact across their organizations. We share this vision and are committed to enhancing our contributions. Over the past few months, our leadership team has spent significant time reviewing and refining our strategy, vision, and values. More details to follow on this, but in essence, our focus remains clear:
Deep-Insight – Providing innovative CX consultancy to global B2B organisations underpinned by a strong and competitive technical and data foundation.
We’re eager to explore how we can ensure this strategy delivers the maximum impact for your organization. Expect us to dive deeper into this topic during our “Close the Loop” sessions with you.
Before I conclude, I want to extend a heartfelt thank you to Jade Flynn for planning, organizing, and running this year’s client assessment. Jade joined us earlier this year and has quickly become an invaluable asset to our small but highly dedicated team. We’re grateful for her hard work and excited to see the continued impact she’ll make!
Alexandra Calugarici
Operations Manager, Deep-Insight