The ‘Secret Ingredient’ to Creating a Customer-Centric Organisation

GUEST BLOG FROM PETER WHITELAW, AUSTRALIAN BUSINESS CONSULTANT AND CO-AUTHOR OF “Customer at the Heart”


What is the secret ingredient for creating a customer-centric organisation?

Since John O’Connor and I embarked upon writing the book Customer at the Heart more than a year ago, I have had the opportunity to meet many people interested in customer centricity. I have also delivered several presentations to small and large business groups on the topic. I probably shouldn’t be surprised, but people often asked me the above question. It indicates that people are curious and keen to embark upon the journey towards customer centricity.


Customer At The Heart


My simple answer: Passionate Leadership is the secret ingredient.

All of the senior executives we interviewed for Customer at the Heart demonstrate this trait. We selected them for this reason – to share their passion. However, over many years of assisting organisations to change and become more customer-centric, I have encountered a spectrum of leaders. I’ll tell a couple of stories, but first I need to explain why Passionate Leadership for customers is so important.

The first premise is that leaders are ultimately accountable for the performance of the organisations. The second is that without happy customers, the organisation won’t exist for very long. The logic is simple. Leaders and their organisations don’t survive unless their customers are happy.
 

Business Barriers

Unfortunately, a lot of ‘stuff’ can get in the way of that simple equation. Organisations are continuously evolving and changing as the environment changes. This constant movement creates uncertainty and to counter this we develop rules, policies procedures, role descriptions and other bureaucratic tools to maintain control. Much of this inhibits creativity, innovation and sensitivity to the needs of customers.
 

Culture

Then there’s ‘culture’, commonly described as ‘the way we do things around here’. Much of the current culture is derived from the history of the organisation. The people on board the longest see it as a safe haven and permeate it through to newer members of the team. You can really see the entrenched cultures when you merge two organisations. The problem with entrenched culture is that it’s intransigent. We know people resist change because it’s scary – even when it’s bleeding obvious that we have to change to succeed.
 

Passionate Leadership

Passionate leaders know all this. They’ve usually been there before and they see that their real role is to make change happen. That means challenging the status quo and being prepared to break a few things and rebuild them. They start with the equation ‘happy customers = business performance’ and begin to influence their people into putting customers’ needs into every decision. Alongside that, they challenge their people to question why they do the things they do, unless they ultimately assist the customer. Passionate leaders are risk takers.
 

How to make it happen?

How do leaders do it? They talk constantly about customers and to customers. They visit customers and they ask and they listen. They seek regular information on the quality of customer relationships.

Next, they act on what they learn. They know they can’t change culture overnight, but they can put in train a series of initiatives – all intended to respond to customers’ needs.

By taking this stance and embarking on the journey towards customer centricity, they begin to influence their people. Some will enthusiastically join in, some will remain passive and some will be obstinate resisters. Gradually the culture will shift – even if it means shedding some of the resisters.

Passionate leaders reinforce the momentum by celebrating successes. Their people become collaborators and contributors to change and they grow into their new identities.
 

Case Studies

Last year I met with a passionate leader who has been working assiduously with his leadership team and his people on a 5-year transformation to not only adapt the business to a world of disruptive competition, but also to change the internal culture. He’s been doing this ‘brick-by-brick’ so that the company is now clearly differentiated from competitors because of its superior customer service and depth of relationships.

A couple of years ago I endeavoured to assist an organisation in a very competitive industry where profit margins are thin. Their CEO gave lip service to customer centricity to the extent of branding the business as ‘customer-focused’ while doing little else. The corporate priority was to automate as much of the front-line services as possible, and to shed staff. When I interviewed some of its key customers it was obvious that there was a growing problem. One comment I recall was: “next they’ll be offshoring their customer service”. That CEO has since moved on.

I recently met with a relatively new leadership team who are commencing their customer centricity journey. They have many challenges ahead – a legacy of broken promises, little in-depth insight into their customers, staff who are keen but nervous about the future. However, the new CEO will succeed because he has boundless enthusiasm for customer centricity and he has a leadership team who share his vision and the passion. Their first step is to reach out to customers and listen.
 

The Secret Ingredient

Passionate Leadership is the secret ingredient to building a customer-centric organisation. It’s not the only ingredient. Customer centricity also requires innovation, commitment, time and persistence. It’s also obvious that it will not succeed unless that secret ingredient – ‘passionate leadership’ – is fully activated.


Peter Whitelaw is an Australian consultant providing customer relationship assessments, customer centricity guidance and change management services. Peter has a background in engineering, sales and general management with Hewlett Packard, Tektronix and Optus Communications. For 11 years he was CEO of project and change management training and consulting company Rational Management, training thousands of managers across the world. In recent years he has been lead consultant on several change management and customer centricity projects for both commercial and government organisations.

How to Maximise Completion Rates for a CX Programme?

Setting up and running B2B Customer Experience (CX) programmes is our ‘bread and butter’ at Deep-Insight.

We’re used to handling questions on how to make CX programmes more effective. One of the most common questions we get from first-time clients is: “What completion rates can I expect from my CX programme?” Another common question from longer-term clients is “How do I improve my completion rates?”

Let’s deal with each question in turn.
 

“What Completion Rates can I expect from my CX programme?”

Let me preface this by saying that we are talking about business-to-business (B2B) relationships so there is an inherent assumption in the question that our clients have some existing – and hopefully strong – relationships with their customers and that these contacts will be receptive to a request to give feedback as part of that ongoing relationship.

This is usually the case but clients – particularly senior clients – are busy people so it may not come as a surprise to hear that the average participation rate in a B2B customer assessment is around 35%.

But that 35% figure is an aggregate score and there’s a little more to it than that, if you have a look at the graph below.

completion rates CX Programme
 

The spread is wide.

The most common completion rate is in the 26-30% range. We have a smaller number of clients – typically those who have been running our Customer Relationship Quality (CRQ) assessments for many years – who regularly achieve completion rates of 50% and higher.

If this is your first time running a customer assessment – either a simple Net Promoter Score survey of something a little more complex like our CRQ relationship assessments – you can expect completion rates of less than 1 in 3.

This may sound OK if you regularly run consumer surveys where a 5% completion rate can be a good result, but for an existing long-standing B2B client relationship, it’s paltry. And yet we have been running customer assessments of all sorts for nearly 20 years and these are the actual numbers.

So now let’s get to the second question:
 

“How do I improve my completion rates?”

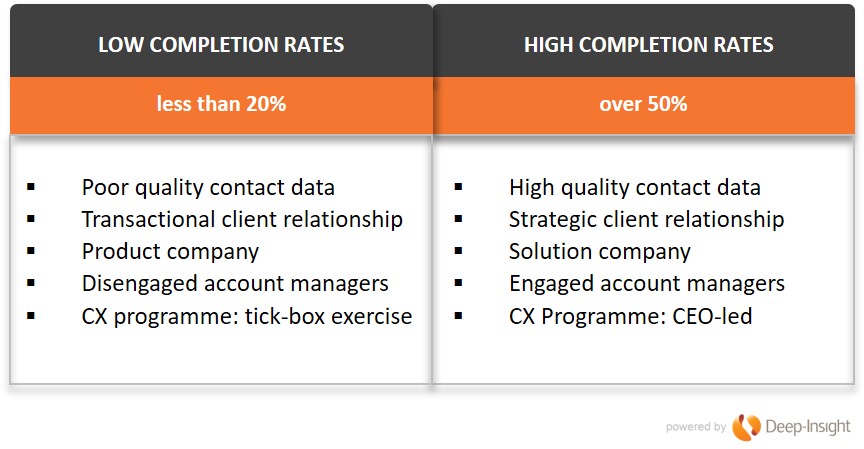
The starting point is to understand why some B2B companies sometimes get really low completion rates and others consistently exceed 50%.

Our lowest-ever completion rate (4%) came from a first-time UK software client. The quality of contact data was simply terrible. We should have spotted that it was little more than a ‘data dump’ from the company’s CRM system. The list included people who had left their companies three years earlier. It included people who had never even heard of our client. It probably included the names of people who were dead. That’s because there was no governance in place for the programme. The Sales Director was not involved. Account Managers did not personally sign off the client contact names. You get the picture.

Our highest-ever completion rate came from a company that has been a client of Deep-Insight’s for 10 years and whose customers view the annual CRQ assessment as a critical part of their ongoing strategic partnership.

But there are other reasons for low and high participation rates. Here’s a quick summary of the profiles of our clients that fit into both categories:

completion rates CX Programme
 

6 Steps to Improve your Completion Rates

Here are the steps you need to take to get your completion rates up:

  1. Make It Strategic. If the CX programme is CEO-led and driven from the top, it will not be seen as another box-ticking exercise. Make sure this is a key item on the Executive agenda.
  2. Put in Governance Structures. By this we mean things like: a) Account Directors should supervise and sign all contact names, not just pull them from the CRM system; b) the Sales Director should personally sign off all Strategic Client contact names.
  3. Don’t call it a Survey! At Deep-Insight, we ban the use of the term “survey” . For us, a CRQ assessment is a strategic ongoing conversation with the clients and their views will be taken seriously.
  4. “Warm Up” the Contacts. An invitation to complete a survey should not come out of the blue. Ideally, it should be introduced by letter or by email by the CEO or Country Manager, and while an assessment is “live”, the account manager will know to stay in touch with the client and urge them to complete the assessment.
  5. Close the Loop. This is critical. If you ask for feedback, you need to share that feedback with the client, agree the actions that BOTH PARTIES will take to improve the relationship.
  6. Repeat. Get into a rhythm where your clients and your sales/account teams know that every February or October (or whenever), the annual strategic assessment will take place. You may want to run frequent assessments. Some companies have quarterly Net Promoter or Pulse assessments – but don’t overdo the frequency. Your organisation needs time to put remedial actions into effect.


Completion Rates of 90% or more?

Follow the above steps and you’ll get your completion rates to 50% or higher.

But remember that these completion rates are at an individual level. You should be getting feedback from multiple people at different levels within each client. Include Influencers and Operational Contacts as well as Key Decision Makers. That way you’ll get a wealth of information about what your key accounts REALLY think of you.

You’ll also get completion rates of 90% at an account level if you take this approach.

If you are interested in reading more about running a CX programme effectively take a look at our process for running a B2B CX assessment or just get in touch with us today for a chat.


Does NPS Work for B2B Companies
 

Are you going to NPS me? Yes, I am!

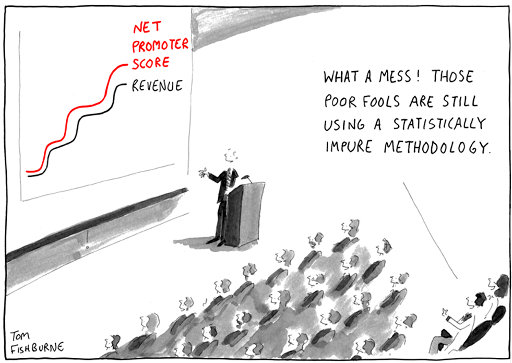
This is the topic of a talk I’m giving this week at a customer loyalty conference in Melbourne. It is in response to another talk entitled “Are you going to NPS me? No I’m not” in which Dr Dave Stewart of Marketing Decision Analysis will be presenting the case that Net Promoter is a deeply flawed concept. Dave will say that NPS should be discarded by organisations that espouse customer advocacy. To be honest, Dave’s position is close to what I thought of the Net Promoter Score concept when it was first introduced by a pretty smart academic and business consultant called Fred Reichheld back in 2003.

Tom Fishburn

Net Promoter Score

Reichheld’s basic premise was that you only need to ask one question in order to understand if a customer is going to stay loyal to you or not. The question is: “How likely are you to recommend us to a friend or colleague?” Fred, being the excellent marketeer that he is, proclaimed the benefits of this Net Promoter Score (NPS) concept in respected publications like the Harvard Business Review. He then promoted it in his own book The Ultimate Question which came out in 2006, shortly after I took on the CEO role here at Deep-Insight. Since then, NPS has became very popular as a customer loyalty metric.

However, NPS has also attracted some heavy criticism. Tim Keiningham gave NPS a particularly scathing review saying that he and his research team could find no evidence for the claims made by Reichheld. (It should be said that Keiningham worked for the market research company Ipsos so his views may not be completely unbiased.)

At that time, my own view was that NPS was probably too simplistic a metric for business-to-business (B2B) companies. I also felt that Deep-Insight’s own customer methodology – which also included a ‘would you recommend’ question – was a much better fit for complex business relationships. And if I’m honest, there was an element of ‘Not Invented Here’ going on in our own organisation as well.

So we decided to ignore NPS.

The Rise of NPS

But here’s the thing: our customers didn’t ignore it. When we ran customer feedback programmes for customers like Reed Elsevier and Atos in the UK, ABN AMRO in the Netherlands, Santander in Poland, and the Toll Group in Australia, they would all ask: “Can you add in the NPS question for us – we have to report the numbers back to headquarters?” Of course, being the good marketeers that we were, we duly obliged. However, we always gave the results back in a separate spreadsheet, so that it wouldn’t contaminate our own reports and our own wonderful methodology!

Roll the clock forward to 2013. NPS still hadn’t gone away. In fact it had become even more popular. It was particularly popular with large international companies where a simple understandable metric was needed to compare results across different divisions and geographical areas. And when I finally looked into it, I discovered that Deep-Insight had actually been gathering NPS data from customers across 86 different countries since 2006.

Is NPS a good predictor of loyalty?

Around the same time we also did some research into our own database to find out what really drove loyalty and profitability in our clients. Now this is not an easy thing to do, as many of you who have tried will know. But where we had several years of customer feedback data, it was relatively straightforward to analyse how many of our clients’ B2B customers were still with them. If they have deliberately defected, we investigated if that defection could have been predicted by a poor Net Promoter Score, or by any of the metrics in our own CRQ methodology.

I have to say that the results were quite interesting. A low ‘Likelihood To Recommend’ was not the BEST predictor of customer defection. However it was actually a pretty good predictor. Deep-Insight’s overall Customer Relationship Quality (CRQ) metric was a slightly better predictor.

A poor Commitment score – one of the key components of CRQ – was the best predictor of whether a B2B client was going to defect to the competition or not.

So there we had it: NPS did actually work.

It worked not because it’s the BEST predictor of whether a client was going to defect, but because it’s a GOOD predictor, coupled with the fact that NPS has been embraced by some of the world’s leading organisations as an easy-to-use and internationally-accepted customer benchmark. 

At Deep-Insight, we came a little late to the party. We only incorporated Net Promoter Score into our customer methodology in early-2014. Today we find that the combination of NPS and our own CRQ metrics works really well for our clients.

The future for NPS

Now let’s go back to the cartoon at the top of the blog (and thank you to the wonderful Tom Fishburne for allowing us to use it). If there is a statistically purer methodology than NPS, why not use that instead?

The answer is simple: most senior executives aren’t interested in re-inventing the wheel. They are much more interested in taking the feedback from their clients and acting on it, so that they can protect and enhance the revenues they get from those clients.

So for those B2B executives who are wondering if NPS is the right customer metric for them or not, I would suggest that you’re asking the wrong question. What good CEOs and Sales Directors are asking these days is:

“If my Net Promoter Score is low or if I have a lot of Opponents and Stalkers as clients, what do I do?”

In fact, the really successful CEOs and Sales Directors are spending the time thinking about the challenges of putting a really effective customer experience (CX) programme in place, rather than worrying about the purity of the metrics. That’s what you should be doing too.

What is a Good B2B Net Promoter Score?

U P D A T E : We now have an updated analysis of what a GOOD B2B Net Promoter Score looks like. It’s based on data from 2015 to 2022.

* * * * * * * * * * * * *
So what is a GOOD B2B Net Promoter Score?

It’s a question we get asked a lot. Sometimes the question comes in slightly different formats. For example:

“What Net Promoter Score target should we set for the company?

“+25 seems a bit low, so maybe +50?”

“Or should we push the boat out and aim for +70?”

Well, it depends on a number of different factors. As we mentioned in an earlier blog, it can even depend on factors such as whether your customers are American or European. Seriously, that makes a big difference.

Customer at the Heart

What Factors Impact Your Net Promoter Score?

It’s crucial to understand how these various factors impact your overall Net Promoter Score. Your NPS result can be very sensitive to small changes in individual customer scores. Be aware of these factors when deciding on a realistic NPS figure to aim for. Most Europeans consider a score of 8 out of 10 to be a pretty positive endorsement of any B2B product or service provider. However, in the NPS world, a person who scores you 8 is a ‘Passive’ and therefore gets ignored when calculating the Net Promoter Score (see box below).

HOW IS THE NET PROMOTER SCORE CALCULATED?

For the uninitiated, a company’s Net Promoter Score is based on the answers its customers give to a single question:

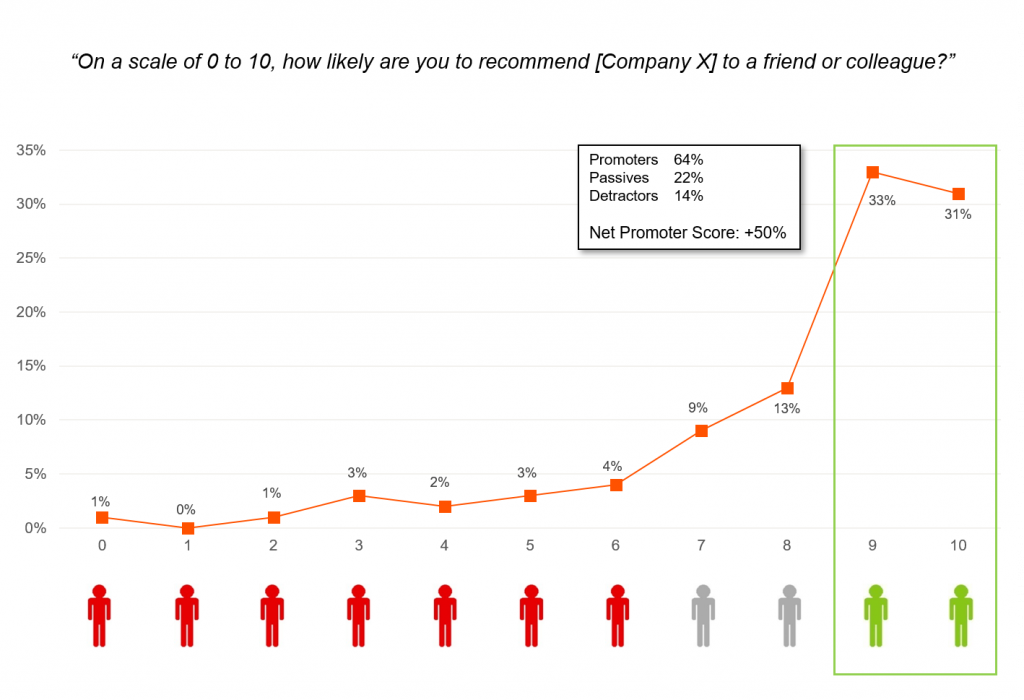
“On a scale of 0 to 10, how likely are you to recommend Company X to a friend or colleague?”

Customers who score 9 or 10 are called ‘Promoters’. Those who score 7 or 8 are ‘Passives’ while any customer who gives you a score of 6 or below is a ‘Detractor’.

The actual NPS calculation is:

Net Promoter Score = Percentage of Promoters MINUS the Percentage of Detractors

Theoretically, companies can have a Net Promoter Score ranging from -100 to +100.

Here’s the thing. If you can persuade a few of your better customers to give you 9 instead of 8, then suddenly you’ve boosted your Promoter numbers significantly. We know more than a handful of account managers who carefully explain to their clients that a score of 8 out of 10 is of no value to them. If clients appreciate the service they are getting they really need to score 9 or 10.

Sure, there’s always a little ‘gaming’ that goes on in client feedback programmes, particularly when performance-related bonuses are dependent on the scores. However, we find it intriguing to see the level of ‘client education’ that account managers engage in when the quarterly or annual NPS survey gets sent out!

Five Key Factors

We said at the outset that the Net Promoter Score you achieve is dependent on a number of factors. Here are the five key factors:

1. Which geographical region do your customers come from?

We’ve covered this point in an earlier discussion with Professor Anne-Wil Harzing. American companies generally get higher NPS results than Europeans – typically 10 points higher and often much more.

2. Do you conduct NPS surveys by telephone or face-to-face or by email?

In the UK and Ireland, we don’t like giving bad news – certainly not in a face-to-face (F2F) discussion. Even if we’re talking over the phone, we tend to modify our answers to soften the blow if the feedback is negative. Result: scores are often inflated. In our experience, online assessments give more honest results but can result in scores 10 points (or more) lower than in telephone or F2F surveys. This gap can be smaller in countries like the Netherlands, Germany and Australia where conversations tend to be more robust. It’s a cultural thing.

3. Is the survey confidential?

Back to the point about culture – it’s easier to give honest feedback if you can do so confidentially. This is particularly the case if the customer experience has been negative or if you have a harsh message to deliver. Surveys that are not confidential tend to paint a much rosier picture than those that are confidential.

4. Is there a governance structure in place?

At Deep-Insight, we advocate a census approach when it comes to customer feedback. Every B2B customer above a certain size MUST be included in the assessment. No ifs or buts. Yet we are often amazed by the number of companies that allow exceptions. For example: “We’re at a sensitive stage of our relationship with Client X so we’re not going to include them”. In many cases, it’s more blatant. Clients are excluded because everybody knows they will give poor feedback. A proper governance structure is required to ensure ‘gaming’ is kept to a minimum. This gives the survey process credibility.

5. Is the survey carried out by an independent third party, or is it an in-house survey?

In-house surveys can be cost-effective but suffer from a number of drawbacks. The main drawback is that they generally result in inflated scores. For starters, in-house surveys are rarely confidential and are more prone to ‘gaming’ than surveys run by an independent third party. We have seen cases where in-house surveys have been replaced by external providers and the NPS scores have dropped by a whopping 30 points or more. Seriously, the differences are that significant.

So what is a GOOD NPS score for B2B companies?

Now, let’s get back to the question of what constitutes a good B2B Net Promoter Score. Here’s our take on it.

Despite the claims that one hears at conferences and on the Internet that “we achieved +62 in our last NPS survey”, such scores are rarely if ever achieved. We’ve collected NPS data for B2B clients across 86 different countries since 2006. Our experience is that in a properly-governed independent confidential assessment, a Net Promoter Score of +50 or more is extremely rare. Think about it. To get 50, you need a profile like the one below, where a significant majority of responses are 9 or 10. In Europe, that simply doesn’t happen.

B2B Net Promoter Score
Our experience of B2B assessments is that A NET PROMOTER SCORE OF +30 IS EXCELLENT and generally means you are seen as ‘Unique’ by your customers.

A NET PROMOTER SCORE OF ABOUT +10 IS PAR FOR THE COURSE. Consider +10 to be an average NPS score for a B2B company in the UK or northern Europe.

Note that negative Net Promoter Scores are not unusual. Approximately one third of Deep-Insight’s B2B clients have negative scores. One in 10 has a score of -30 or even lower.

Benchmarking

One final comment about benchmarking. Deep-Insight’s customer base is predominantly northern European or Australian. However, many of our clients operate in eastern or southern Europe – and in Asia or North America. We need to be careful about how we benchmark different divisions within the same company that are in different regions.

In our opinion, the best benchmark – for a company, business unit or division – is last year’s score. If your NPS is higher this year than it was last year, then you’re moving in the right direction. And if your NPS was positive last year, and is even more positive this year, happy days!

* Net Promoter® and NPS® are registered trademarks and Net Promoter SystemSM and Net Promoter ScoreSM are trademarks of Bain & Company, Satmetrix Systems and Fred Reichheld