Avoiding the CX Rat Trap

A story of rats, cobras and economists
This is a story about rats, cobras and economists (and no, they’re not the same thing!) but it’s primarily a blog about a British economist called Charles Goodhart and his take on target setting, key performance indicators (KPIs) and the law of unintended consequences.
Goodhart is a man whose musings are worth reading if you’re struggling to make your customer experience (CX) programme work. All CX programmes involve the measurement of customer satisfaction (CSat), Net Promoter Score (NPS) or similar KPI. Companies will sometimes incentivise their employees to achieve a particular CX objective: “If we hit our NPS target of +50 this year, all sales staff get an additional bonus of £1,000.” This is not an uncommon practice. It’s also not a good one, as we are going to find out shortly.
Charles Goodhart is best known for Goodhart’s Law, which is neatly summarised in the Sketchplanations cartoon above. Setting targets can result in unintended consequences, particularly where incentives are involved.
Before we delve into Goodhart and his famous law, let’s start with a couple of stories about rats and cobras.

The Great Hanoi Rat Hunt
In 1902, the French ruled Indochina, a region in South East Asia comprised of modern-day Cambodia, Laos and Vietnam. The capital and administrative centre was Hanoi.
That year, the French administrators introduced a bounty on rats after it was discovered that rats played a significant role in transmitting the plague. The Third Plague Pandemic was a pretty serious issue in Asia at the time. It had spread from China in the late nineteenth century and by the time it was finally eradicated in the 1960s, more than 10 million people had died from the plague.
A bounty seemed to make sense. To claim it, the locals simply had to bring in a bag of rat tails. There was no need for piles of dead rats clogging up the corridors of power in Hanoi – tails would suffice. Within weeks, the bounty was working. Hundreds of rat tails poured in. Then thousands. It seemed too good to be true, and so it turned out to be.
It didn’t take long for French officials to figure out what was happening. The bounty had created an entirely new industry in Hanoi where rodent tails were brought into the capital from the countryside. Worse still, entrepreneurs in Hanoi started to breed rats in order to increase their bounty revenues. The number of rats in Hanoi was increasing, rather than decreasing.
Eventually, the bounty was discontinued. This story of administrative failure and unintended consequences is told in Michael Vann’s book The Great Hanoi Rat Hunt.
The Cobra Effect
It’s not just the French who were outwitted by their colonial subjects. A similar case happened under British rule in India, and documented in Horst Siebert’s book Der Kobra-Effekt.
At the same time that the French were grappling with a rat epidemic in Hanoi, the British were dealing with a cobra explosion in India. Cobras were viewed by the British administrators as deadly pests and a bounty was introduced in Delhi for every dead cobra handed in to the authorities. Many cobras were killed and handed in but, to the bemusement of the British rulers, the cobra population seemed to be on the rise.
It’s the same story of simple economics: the cost of breeding a cobra was significantly lower than the bounty, so entrepreneurs started to breed cobras. When the bounty was stopped, the breeders released the remaining cobras into the wild, further exacerbating the situation.

Goodhart's Law
Charles Goodhart is a British economist. He was born in 1936 and spent nearly 20 years of his career at the Bank of England, working on and writing about public and financial policy. In 1975, he wrote a paper containing the line: “whenever a government seeks to rely on a previously observed statistical regularity for control purposes, that regularity will collapse.”
The comment was specifically about monetary policy but would later be generalised as a law about targets, metrics and key performance indicators (KPIs). In 1997, the anthropologist Marilyn Strathern expressed Goodhart’s Law as follows when she was investigating grade inflation in university examinations:
When a measure becomes a target, it ceases to be a good measure. The more a 2.1 examination performance becomes an expectation, the poorer it becomes as a discriminator of individual performances. Targets that seem measurable become enticing tools for improvement.
Marilyn Strathern’s interpretation that has become the most widely used today.
When a measure becomes a target, it ceases to be a good measure
Charles Goodhart
The basic message from Goodhart’s Law is a simple one: beware the law of unintended consequences when you set targets for people to achieve.
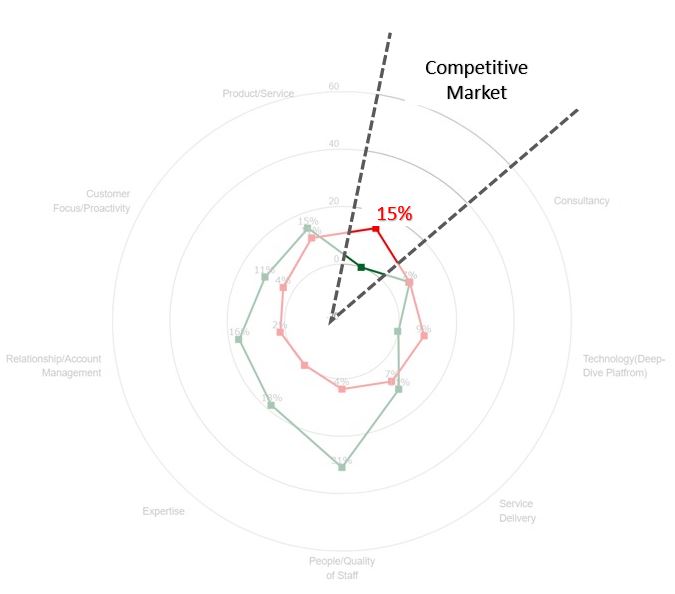
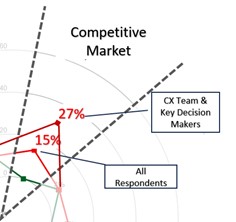
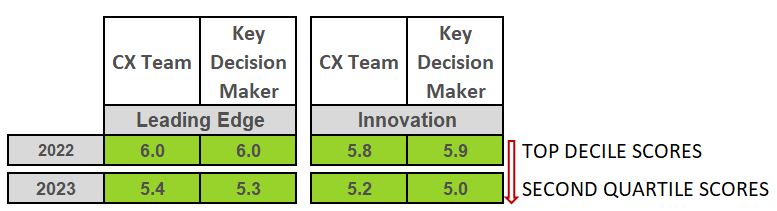
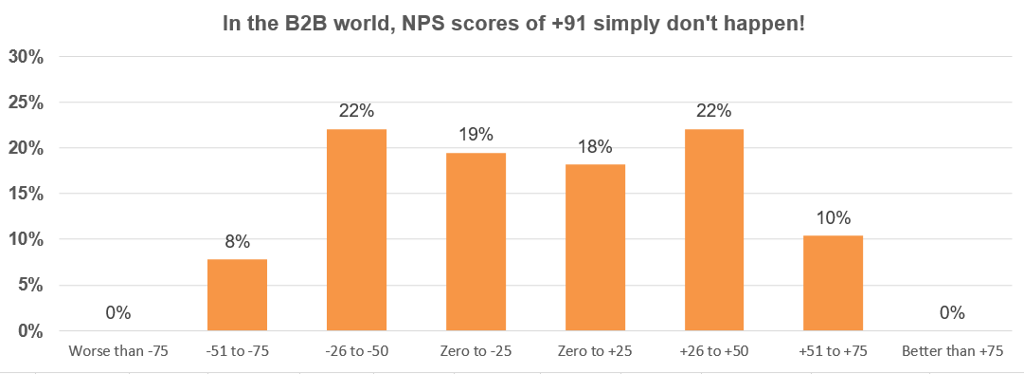
This is equally true when companies set targets in the field of customer experience (CX). If senior leadership teams incentivise their sales people and account managers to hit Net Promoter Score (NPS) targets, they will be achieved come hell or high water. In a previous blog, I outlined how CX programmes are often ‘gamed’ to achieve ridiculously high NPS targets which bear no relationship to the company’s actual performance. Common actions taken to game the CX system include:
- Selecting only those clients who are Ambassadors for you and your product or service, when you are looking for customer feedback
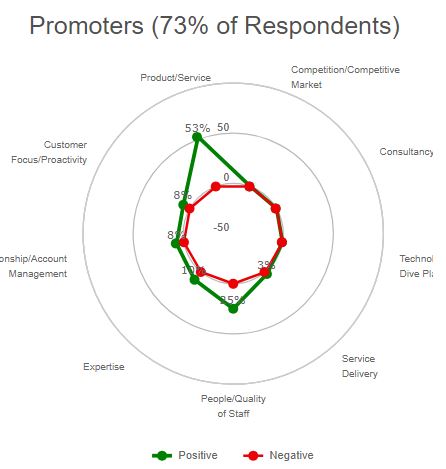
- Within those clients, selecting only those individuals who you know will score you 9/10 or 10/10 (these are ‘Promoters’ in NPS terminology)
- Making sure to deselect any client that is likely to give you a poor score, using excuses like: “Now is not the right time to ask their views” or “We’ll only antagonise them if we approach them now”
- Refusing to send a survey to anybody who doesn’t know you really well, even if it’s a senior decision maker that you’d love to have a conversation with. Why? The chances of them scoring you 9 or 10 are slim
- Not outsourcing the NPS survey process to a third party that can give the option of confidentiality to survey participants – confidential surveys are likely to elicit lower scores even if they provide a much more realistic and honest view of your product or service
In many cases, employees and leadership teams are unaware that they are gaming the system. They simply believe that they are doing the right thing for the company.
Avoiding the CX Rat Trap - 5 Rules
Rule No. 1: Do not incentivise employees to achieve CX targets. It’s that simple. If you do, you’ll end up with more rats and cobras than you can handle.
Rule No. 2: If your Senior Leadership Team or Board is bonused on achieving NPS results, stop this practice immediately! You would be amazed at the number of companies that engage in such bonus schemes.
Rule No. 3: Resist the temptation to publish your Net Promoter Score in your annual report. All you are doing is setting yourself up for inflated NPS results as nobody in the organisation will want to be associated with a ‘down year’. It’s human nature. By accident or design, employees and leaders will game the system to achieve higher scores next year.
Rule No. 4: Put a robust CX governance structure in place. Make sure ALL clients are surveyed. Sign off the contact lists. Resist the urge to exclude people whose views might be unfavourable – you want to know what they are thinking.
Rule No. 5: Finally, don’t approach CX with the mindset of a colonial administrator! Senior leadership teams have to view customer feedback as a gift. They have to encourage their colleagues to be open about getting feedback, whether good, bad or indifferent. Without honest feedback, change will never happen. Poor practices will continue and eventually clients will leave.
Finally, if you want to find out more about how to set up and run a customer experience (CX) programme effectively, contact us for a chat. We’d love to hear from you.