U P D A T E : We now have an updated analysis of what a GOOD B2B Net Promoter Score looks like. It’s based on data from 2015 to 2022.
It’s a question we get asked a lot. Sometimes the question comes in slightly different formats. For example:
“What Net Promoter Score target should we set for the company?
“+25 seems a bit low, so maybe +50?”
“Or should we push the boat out and aim for +70?”
Well, it depends on a number of different factors. As we mentioned in an earlier blog, it can even depend on factors such as whether your customers are American or European. Seriously, that makes a big difference.

What Factors Impact Your Net Promoter Score?
It’s crucial to understand how these various factors impact your overall Net Promoter Score. Your NPS result can be very sensitive to small changes in individual customer scores. Be aware of these factors when deciding on a realistic NPS figure to aim for. Most Europeans consider a score of 8 out of 10 to be a pretty positive endorsement of any B2B product or service provider. However, in the NPS world, a person who scores you 8 is a ‘Passive’ and therefore gets ignored when calculating the Net Promoter Score (see box below).
HOW IS THE NET PROMOTER SCORE CALCULATED?
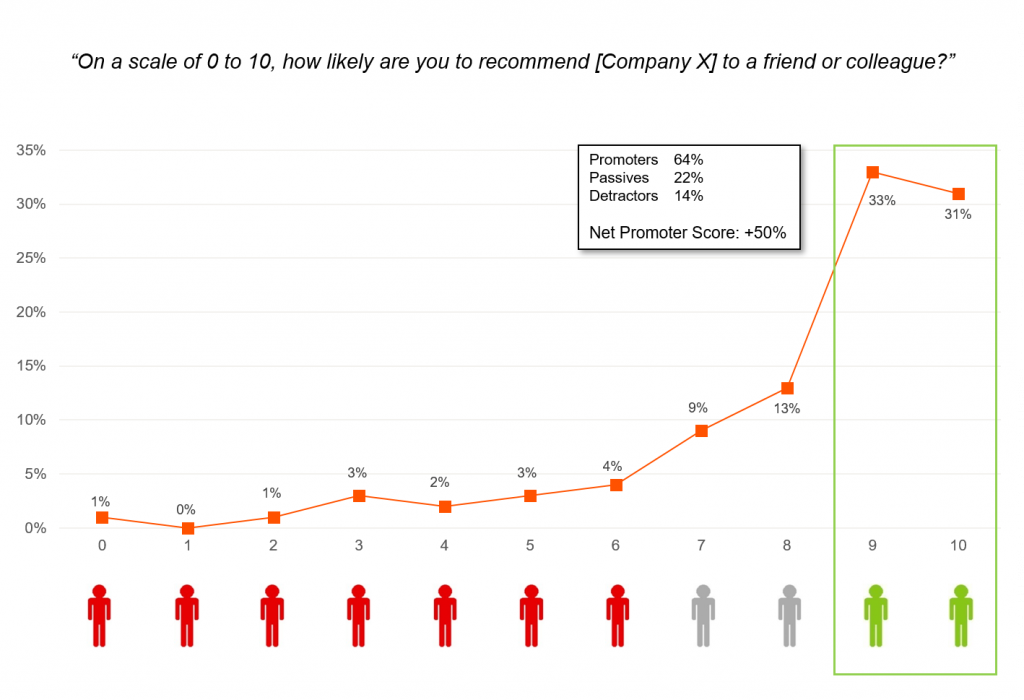
For the uninitiated, a company’s Net Promoter Score is based on the answers its customers give to a single question:
“On a scale of 0 to 10, how likely are you to recommend Company X to a friend or colleague?”
Customers who score 9 or 10 are called ‘Promoters’. Those who score 7 or 8 are ‘Passives’ while any customer who gives you a score of 6 or below is a ‘Detractor’.
The actual NPS calculation is:
Net Promoter Score = Percentage of Promoters MINUS the Percentage of Detractors
Theoretically, companies can have a Net Promoter Score ranging from -100 to +100.
Here’s the thing. If you can persuade a few of your better customers to give you 9 instead of 8, then suddenly you’ve boosted your Promoter numbers significantly. We know more than a handful of account managers who carefully explain to their clients that a score of 8 out of 10 is of no value to them. If clients appreciate the service they are getting they really need to score 9 or 10.
Sure, there’s always a little ‘gaming’ that goes on in client feedback programmes, particularly when performance-related bonuses are dependent on the scores. However, we find it intriguing to see the level of ‘client education’ that account managers engage in when the quarterly or annual NPS survey gets sent out!
Five Key Factors
We said at the outset that the Net Promoter Score you achieve is dependent on a number of factors. Here are the five key factors:
1. Which geographical region do your customers come from?
We’ve covered this point in an earlier discussion with Professor Anne-Wil Harzing. American companies generally get higher NPS results than Europeans – typically 10 points higher and often much more.
2. Do you conduct NPS surveys by telephone or face-to-face or by email?
In the UK and Ireland, we don’t like giving bad news – certainly not in a face-to-face (F2F) discussion. Even if we’re talking over the phone, we tend to modify our answers to soften the blow if the feedback is negative. Result: scores are often inflated. In our experience, online assessments give more honest results but can result in scores 10 points (or more) lower than in telephone or F2F surveys. This gap can be smaller in countries like the Netherlands, Germany and Australia where conversations tend to be more robust. It’s a cultural thing.
3. Is the survey confidential?
Back to the point about culture – it’s easier to give honest feedback if you can do so confidentially. This is particularly the case if the customer experience has been negative or if you have a harsh message to deliver. Surveys that are not confidential tend to paint a much rosier picture than those that are confidential.
4. Is there a governance structure in place?
At Deep-Insight, we advocate a census approach when it comes to customer feedback. Every B2B customer above a certain size MUST be included in the assessment. No ifs or buts. Yet we are often amazed by the number of companies that allow exceptions. For example: “We’re at a sensitive stage of our relationship with Client X so we’re not going to include them”. In many cases, it’s more blatant. Clients are excluded because everybody knows they will give poor feedback. A proper governance structure is required to ensure ‘gaming’ is kept to a minimum. This gives the survey process credibility.
5. Is the survey carried out by an independent third party, or is it an in-house survey?
In-house surveys can be cost-effective but suffer from a number of drawbacks. The main drawback is that they generally result in inflated scores. For starters, in-house surveys are rarely confidential and are more prone to ‘gaming’ than surveys run by an independent third party. We have seen cases where in-house surveys have been replaced by external providers and the NPS scores have dropped by a whopping 30 points or more. Seriously, the differences are that significant.
So what is a GOOD NPS score for B2B companies?
Now, let’s get back to the question of what constitutes a good B2B Net Promoter Score. Here’s our take on it.
Despite the claims that one hears at conferences and on the Internet that “we achieved +62 in our last NPS survey”, such scores are rarely if ever achieved. We’ve collected NPS data for B2B clients across 86 different countries since 2006. Our experience is that in a properly-governed independent confidential assessment, a Net Promoter Score of +50 or more is extremely rare. Think about it. To get 50, you need a profile like the one below, where a significant majority of responses are 9 or 10. In Europe, that simply doesn’t happen.
Our experience of B2B assessments is that A NET PROMOTER SCORE OF +30 IS EXCELLENT and generally means you are seen as ‘Unique’ by your customers.
A NET PROMOTER SCORE OF ABOUT +10 IS PAR FOR THE COURSE. Consider +10 to be an average NPS score for a B2B company in the UK or northern Europe.
Note that negative Net Promoter Scores are not unusual. Approximately one third of Deep-Insight’s B2B clients have negative scores. One in 10 has a score of -30 or even lower.
Benchmarking
One final comment about benchmarking. Deep-Insight’s customer base is predominantly northern European or Australian. However, many of our clients operate in eastern or southern Europe – and in Asia or North America. We need to be careful about how we benchmark different divisions within the same company that are in different regions.
In our opinion, the best benchmark – for a company, business unit or division – is last year’s score. If your NPS is higher this year than it was last year, then you’re moving in the right direction. And if your NPS was positive last year, and is even more positive this year, happy days!
* Net Promoter® and NPS® are registered trademarks and Net Promoter SystemSM and Net Promoter ScoreSM are trademarks of Bain & Company, Satmetrix Systems and Fred Reichheld