Limerick’s Net Promoter score is only +7

This is a theme I’ve explored a few times in the past: the NPS results for sports teams.

Despite an imperious performance by the Shannonsiders in last weekend’s All-Ireland Hurling Final, Limerick’s Net Promoter score is only +7.

The Greatest Final in Modern Times?

On Sunday, we witnessed one of the greatest hurling matches of the modern era. Hurling, you ask? A game played with sticks and a small hard ball called a sliotar. The greatest, fastest, most skillful game in the world. It truly is.

I should declare an allegiance here. Even though Deep-Insight is headquartered in Cork, I was born in Limerick. Although I didn’t live in the county for very long, I do support the Shannonsiders whenever it gets to the business end of an All-Ireland Hurling championship.

Last Sunday was All-Ireland Final day and it was a contest between the two best teams in the country: Limerick and Cork. It turned out to be a game of men against minnows as Limerick bullied and outplayed Cork into submission in an enthralling display of hurling. The final score: Limerick 3-32 to Cork’s 1-22.

Limerick Player Ratings

Here’s Paul Keane’s full list of Limerick player ratings from this week’s Irish Examiner:

Nickie Quaid: Not much he could do about Shane Kingston’s early bullet that flew past him to the net. Kept a clean sheet thereafter and mixed up his puck-outs well, going short when the opportunities were there. 8 (‘Passive’ score in NPS terminology)

Sean Finn: Beaten by Shane Kingston for the Cork goal. Started on Jack O’Connor though switched over to Patrick Horgan for a period. Horgan took him for two points from play but both were serious efforts from the Cork captain. 8 (Passive)

Dan Morrissey: Expected to pick up Patrick Horgan and did so for the most part, holding the prolific forward scoreless from play in that time. Locked down a mean defence that had to deal with an early Cork whirlwind. 8 (Passive)

Barry Nash: Punched the air in delight after closing out the first-half scoring with a long-range point. Still there at the death, attempting to tag on one last score for the Shannonsiders. 8 (Passive)

Diarmaid Byrnes: At his very best again. It was Byrnes’ precise pass that created Aaron Gillane’s goal and he split the posts for a trademark long-range point approaching half-time. Denied Seamus Harnedy a goal with a 64th-minute block. 8 (Passive)

Declan Hannon: Another textbook display at the centre of the Limerick defence. Used all his leadership to nail the quarterback role. Helped get Limerick going with an early point from distance and finished with 0-2. Hobbled off to a huge ovation late on. 8 (Passive)

Kyle Hayes: None of the drama of the Munster final when he scored the goal of the season but still worked tirelessly, winning frees and shooting for points long after the result was beyond doubt. 7 (Passive)

William O’Donoghue: A big part of why Limerick got on top in the middle third. Emptied his tank and strung together the play intelligently. 7 (Passive)

Darragh O’Donovan: On point and crisp at midfield, delivering accurate passes throughout and thundering through the exchanges. One of 13 different Limerick players to get on the scoresheet on the day. 8 (Passive)

Gearóid Hegarty: A huge performance from the reigning Hurler of the Year. Clipped 2-2 and struck two wides in the first half alone as he opened up with some spectacular hurling. Eventually replaced to huge cheers. 8 (Passive)

Cian Lynch: Pointed after 11 seconds and never let up, setting up both of Gearóid Hegarty’s goals. Toyed with the Cork defence at times, finishing with six points from play. His interception and flick up for Tom Morrissey’s 18th-minute point was outrageous. 9 (Promoter)

Tom Morrissey: Mixed silk with steel, showing an awesome work rate but also an ability to pick off a series of deft passes that led to important scores. Weighed in with three points from play himself on another landmark day. 8 (Passive)

Aaron Gillane: Hard to believe now he didn’t start the Munster final. Looked like a player keen to prove a point and was on fire throughout, finishing with the first-half with 1-3 and adding another three points for a 1-6 haul. 8 (Passive)

Seamus Flanagan: Helped put the game beyond Cork during Limerick’s early blitzkrieg, pointing sumptuously in the eighth minute and passing to Aaron Gillane for the second goal. Scored just a point but set up so much more. 8 (Passive)

Peter Casey: A bittersweet afternoon for the Na Piarsaigh man. Clear to play after his red card in the semi-final and on fire for 30 minutes, shooting 0-5 from play. Then crumpled with a left knee injury and had to come off. 8 (Passive)


Limerick’s Net Promoter score is only +7

The best ranking player was Cian Lynch who strode the field like a Colossus but who was the only player to get 9/10 from the Irish Examiner correspondent.

15 players and only one achieved a score consistent with a ‘Promoter’ ranking of 9 or 10; Everybody else was a Passive, in a match where Limerick utterly dominated their Munster rivals and played one of the most memorable matches in living memory.

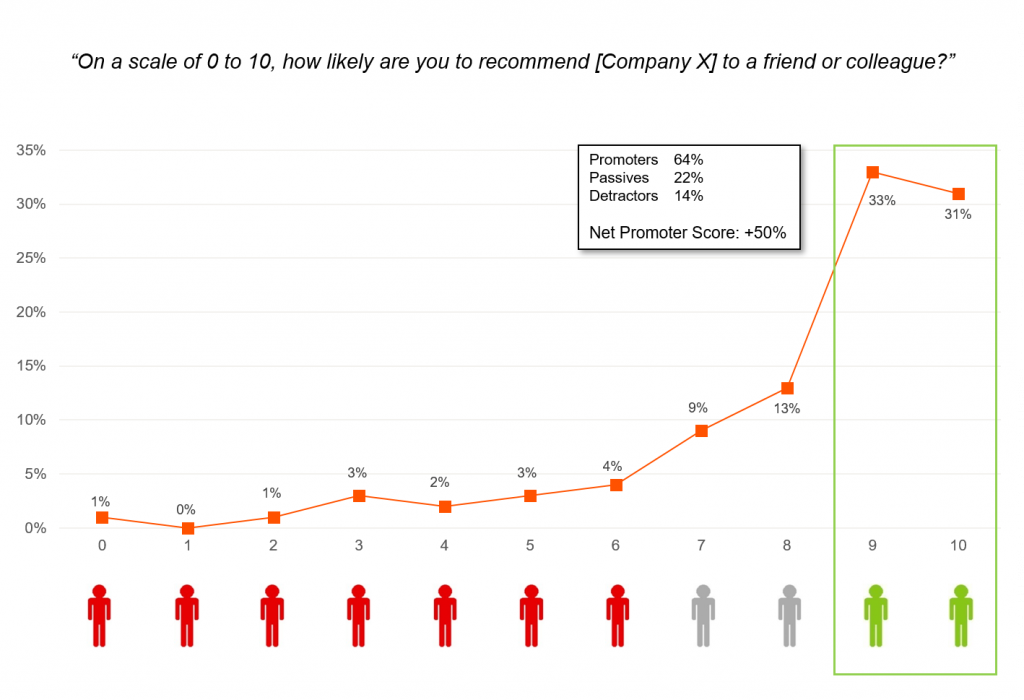
Net Promoter Score = % of Promoters (7%) less % of Detractors (0%), hence a Net Promoter Score of +7.

Benchmarking

I have written before about how benchmarking needs to be conducted carefully when you compare scores from customers in different countries.

I have also written about how people in different countries are culturally programmed to score in particular ways. The most obvious example is that Americans are more prone to score more positively than Europeans if they receive a good service.

This is an important point to remember if you are running a Customer Experience (CX) programme across a global client base. An average Net Promoter score for Northern European B2B companies is no higher than +10. For American companies, it’s more like +20 or +30, a score that would be regarded as ‘excellent’ in a Northern European context.

So be careful when comparing NPS results across different jurisdictions. If it helps, just remember that Limerick’s Net Promoter score is only +7 in a year where they dominated the All-Ireland hurling final!

UPDATE (17 July 2022 All-Ireland Final)

Yesterday, Limerick won the All-Ireland Hurling Final again. This time they defeated Kilkenny in another enthralling battle that ended 1-31 to 2-26.

Sadly, their Net Promoter Score was -13. Yes, MINUS 13, according to Conor McKeon of The Independent:

Nickie Quaid – 7
Seán Finn – 7
Mike Casey – 7
Barry Nash – 8
Diarmaid Byrnes – 9
Declan Hannon – 8
Dan Morrissey – 6
Wiliam O’Donoghue – 6
Darragh O’Donovan – 6
Gearóid Hegarty – 9
Kyle Hayes – 8
Tom Morrissey – 8
Aaron Gillane – 7
Séamus Flanagan – 7
Graeme Mulcahy – 5


If Trust is so important, why do so few companies measure it?

Most people understand implicitly that good Business to Business (B2B) relationships are built on a strong foundation of trust. But if Trust is so important, why do so few companies measure it? It’s a question that has always intrigued me. I must admit that I’m still struggling to find the answer.

The fact is that CEOs keep tabs on all sorts of KPIs. For operational performance, there are lots of service level agreements (SLAs) and other three letter acronyms (TLAs). Logistics companies even have five letter acronyms like DIFOT – Delivery In Full On Time. For financial performance, the CFO has an eye-watering array of metrics. For customer performance, there is customer satisfaction (CSat) and Net Promoter Score (NPS).

But rarely, if ever, is there a metric for Trust that is discussed by the leadership team or reported to shareholders.
 

How Important is Trust?

A couple of weeks ago, I ran a short poll on LinkedIn, asking people what they thought was the most important element of a strong B2B relationship. It wasn’t a trick question as we believe at Deep-Insight (based on pretty good academic research) that the three key pillars of a great B2B relationship are Trust, Commitment and Satisfaction.

I wasn’t surprised by the winner but I was intrigued by the margin. It appears that Trust really is seen as the cornerstone of a strong B2B relationship.

Trust Commitment Satisfaction
 

Trust, Commitment and Satisfaction

How are they all related? Here’s how we explain it.

If you take a purely commercial view of any business relationship – and you shouldn’t – it’s all about the revenues you can generate from that relationship over the long term. I know that’s a bit mercenary but that’s how some people view things. The greatest predictor of a long-term relationship is Commitment and it’s important that you measure your clients’ commitment to you. We ask that question quite bluntly to our clients’ customers: “Are you committed to a long-term relationship with [Name of Client]?”

It turns out that the answer to this question has the highest correlation with the likelihood of the company buying from our client again in the future. The opposite is also true. A poor score is the best predictor that the customer will defect to the competition.

But remember: commitment to a long-term relationship is only the outcome of other factors. Two of the most important factors are Trust and Satisfaction. Trust is all about fairness, honesty and acting with integrity. It’s a reflection on what clients think of your brand but, more important, it’s their perception of how trustworthy your people are as well.

Satisfaction, on the other hand, is a measure of how well you meet (or exceed) a client’s expectations. It’s more transactional than Trust, and also more volatile. For example, you can be satisfied with your IT service provider today, but deeply unhappy tomorrow when the network crashes and your factories or stores can’t operate. When the IT service provider pulls out all the stops and fixes the problem in double-quick time, you’re both relieved and satisfied again. Satisfaction scores can fluctuate wildly. Trust scores? Not so much.


Trust at Serco

One of our clients that takes Trust seriously is Serco. It’s one of Serco’s four stated values: Trust, Care, Innovation and Pride.

Trust at Serco

Serco is quite clear about both what Trust is, and what it is not. Here are the behaviours it expects from its people:

  • Do what they say they will, try their best and see things through
  • Consistently provide the highest standards of customer service
  • Have a can-do, will-do attitude
  • Are open and honest
  • Communicate truthfully, clearly and concisely
  • Aim to always do the right thing and never compromise our values
  • Think through the consequences of their decisions
  • Speak out when they see something wrong
  • Understand who our customers are, listen to them and act upon their feedback
  • Challenge assumptions in an appropriate way
  • Acknowledge when they make mistakes and take responsibility for correcting them
  •  

    Similarly, Serco believes Trust is not demonstrated if employees or the leadership:

  • Make promises that we cannot keep
  • Rush to provide solutions before listening to others’ needs and opinions
  • Fail to keep customers and colleagues informed
  • Are not straightforward and transparent
  • Allow disrespectful or discriminatory behaviour
  • Knowingly use Serco’s resources for personal gain
  • Break our Code of Conduct or the law
  • Falsify or misrepresent information
  • Ignore and don’t speak up when we see something wrong
  • Choose to ignore adverse criticism
  • Blame others for mistakes we have made or things we have missed
  • Shift our responsibilities to others
  •  

    Why do so few companies measure Trust?

    How many companies measure have identified Trust as a core company value and measure it in a systematic way? The short answer is that very few B2B companies measure Trust at all. Serco is one of the few that even identifies it publicly as a core value. Isn’t that strange? Business magazines and articles are full of ideas and tips for becoming trusted advisors. A lot of CEOs and company boards talk about “trusted relationships” with clients in their annual reports to shareholders.

    Trusted Relationships

    Interestingly, the same CEOs and boards talk about trusted relationships but then quote the company’s Net Promoter Score (NPS). Now don’t get me wrong. There’s nothing wrong with NPS but it’s not a measure of Trust. It’s a measure of Advocacy. Yes, the two are related but it you’re going to talk to shareholders and clients about “Trusted Relationships” or “Acting as Trusted Advisors” then you really should go and measure your performance directly.

    Sometimes NPS isn’t enough. It’s a good metric – simple and easy to understand. But it’s one-dimensional. If you really want to understand how trusted a relationship you have with your clients, you need to measure Trust as well as NPS of CSat (Customer Satisfaction). As a CEO or Sales Director, you need to understand if your key clients are Ambassadors who trust you implicitly, or Stalkers and Opponents who want to get out of the relationship because levels of Trust (and Commitment and Satisfaction) are so low.

    If you want to know more about measuring Trust, have a read of this blog.

    Alternatively, get in touch with us today.


    Are you going to NPS me? Yes, I am!

    This is the topic of a talk I’m giving this week at a customer loyalty conference in Melbourne. It is in response to another talk entitled “Are you going to NPS me? No I’m not” in which Dr Dave Stewart of Marketing Decision Analysis will be presenting the case that Net Promoter is a deeply flawed concept. Dave will say that NPS should be discarded by organisations that espouse customer advocacy. To be honest, Dave’s position is close to what I thought of the Net Promoter Score concept when it was first introduced by a pretty smart academic and business consultant called Fred Reichheld back in 2003.

    Tom Fishburn

    Net Promoter Score

    Reichheld’s basic premise was that you only need to ask one question in order to understand if a customer is going to stay loyal to you or not. The question is: “How likely are you to recommend us to a friend or colleague?” Fred, being the excellent marketeer that he is, proclaimed the benefits of this Net Promoter Score (NPS) concept in respected publications like the Harvard Business Review. He then promoted it in his own book The Ultimate Question which came out in 2006, shortly after I took on the CEO role here at Deep-Insight. Since then, NPS has became very popular as a customer loyalty metric.

    However, NPS has also attracted some heavy criticism. Tim Keiningham gave NPS a particularly scathing review saying that he and his research team could find no evidence for the claims made by Reichheld. (It should be said that Keiningham worked for the market research company Ipsos so his views may not be completely unbiased.)

    At that time, my own view was that NPS was probably too simplistic a metric for business-to-business (B2B) companies. I also felt that Deep-Insight’s own customer methodology – which also included a ‘would you recommend’ question – was a much better fit for complex business relationships. And if I’m honest, there was an element of ‘Not Invented Here’ going on in our own organisation as well.

    So we decided to ignore NPS.

    The Rise of NPS

    But here’s the thing: our customers didn’t ignore it. When we ran customer feedback programmes for customers like Reed Elsevier and Atos in the UK, ABN AMRO in the Netherlands, Santander in Poland, and the Toll Group in Australia, they would all ask: “Can you add in the NPS question for us – we have to report the numbers back to headquarters?” Of course, being the good marketeers that we were, we duly obliged. However, we always gave the results back in a separate spreadsheet, so that it wouldn’t contaminate our own reports and our own wonderful methodology!

    Roll the clock forward to 2013. NPS still hadn’t gone away. In fact it had become even more popular. It was particularly popular with large international companies where a simple understandable metric was needed to compare results across different divisions and geographical areas. And when I finally looked into it, I discovered that Deep-Insight had actually been gathering NPS data from customers across 86 different countries since 2006.

    Is NPS a good predictor of loyalty?

    Around the same time we also did some research into our own database to find out what really drove loyalty and profitability in our clients. Now this is not an easy thing to do, as many of you who have tried will know. But where we had several years of customer feedback data, it was relatively straightforward to analyse how many of our clients’ B2B customers were still with them. If they have deliberately defected, we investigated if that defection could have been predicted by a poor Net Promoter Score, or by any of the metrics in our own CRQ methodology.

    I have to say that the results were quite interesting. A low ‘Likelihood To Recommend’ was not the BEST predictor of customer defection. However it was actually a pretty good predictor. Deep-Insight’s overall Customer Relationship Quality (CRQ) metric was a slightly better predictor.

    A poor Commitment score – one of the key components of CRQ – was the best predictor of whether a B2B client was going to defect to the competition or not.

    So there we had it: NPS did actually work.

    It worked not because it’s the BEST predictor of whether a client was going to defect, but because it’s a GOOD predictor, coupled with the fact that NPS has been embraced by some of the world’s leading organisations as an easy-to-use and internationally-accepted customer benchmark. 

    At Deep-Insight, we came a little late to the party. We only incorporated Net Promoter Score into our customer methodology in early-2014. Today we find that the combination of NPS and our own CRQ metrics works really well for our clients.

    The future for NPS

    Now let’s go back to the cartoon at the top of the blog (and thank you to the wonderful Tom Fishburne for allowing us to use it). If there is a statistically purer methodology than NPS, why not use that instead?

    The answer is simple: most senior executives aren’t interested in re-inventing the wheel. They are much more interested in taking the feedback from their clients and acting on it, so that they can protect and enhance the revenues they get from those clients.

    So for those B2B executives who are wondering if NPS is the right customer metric for them or not, I would suggest that you’re asking the wrong question. What good CEOs and Sales Directors are asking these days is:

    “If my Net Promoter Score is low or if I have a lot of Opponents and Stalkers as clients, what do I do?”

    In fact, the really successful CEOs and Sales Directors are spending the time thinking about the challenges of putting a really effective customer experience (CX) programme in place, rather than worrying about the purity of the metrics. That’s what you should be doing too.

    What is a Good B2B Net Promoter Score?

    U P D A T E : We now have an updated analysis of what a GOOD B2B Net Promoter Score looks like. It’s based on data from 2015 to 2022.

    * * * * * * * * * * * * *
    So what is a GOOD B2B Net Promoter Score?

    It’s a question we get asked a lot. Sometimes the question comes in slightly different formats. For example:

    “What Net Promoter Score target should we set for the company?

    “+25 seems a bit low, so maybe +50?”

    “Or should we push the boat out and aim for +70?”

    Well, it depends on a number of different factors. As we mentioned in an earlier blog, it can even depend on factors such as whether your customers are American or European. Seriously, that makes a big difference.

    Customer at the Heart

    What Factors Impact Your Net Promoter Score?

    It’s crucial to understand how these various factors impact your overall Net Promoter Score. Your NPS result can be very sensitive to small changes in individual customer scores. Be aware of these factors when deciding on a realistic NPS figure to aim for. Most Europeans consider a score of 8 out of 10 to be a pretty positive endorsement of any B2B product or service provider. However, in the NPS world, a person who scores you 8 is a ‘Passive’ and therefore gets ignored when calculating the Net Promoter Score (see box below).

    HOW IS THE NET PROMOTER SCORE CALCULATED?

    For the uninitiated, a company’s Net Promoter Score is based on the answers its customers give to a single question:

    “On a scale of 0 to 10, how likely are you to recommend Company X to a friend or colleague?”

    Customers who score 9 or 10 are called ‘Promoters’. Those who score 7 or 8 are ‘Passives’ while any customer who gives you a score of 6 or below is a ‘Detractor’.

    The actual NPS calculation is:

    Net Promoter Score = Percentage of Promoters MINUS the Percentage of Detractors

    Theoretically, companies can have a Net Promoter Score ranging from -100 to +100.

    Here’s the thing. If you can persuade a few of your better customers to give you 9 instead of 8, then suddenly you’ve boosted your Promoter numbers significantly. We know more than a handful of account managers who carefully explain to their clients that a score of 8 out of 10 is of no value to them. If clients appreciate the service they are getting they really need to score 9 or 10.

    Sure, there’s always a little ‘gaming’ that goes on in client feedback programmes, particularly when performance-related bonuses are dependent on the scores. However, we find it intriguing to see the level of ‘client education’ that account managers engage in when the quarterly or annual NPS survey gets sent out!

    Five Key Factors

    We said at the outset that the Net Promoter Score you achieve is dependent on a number of factors. Here are the five key factors:

    1. Which geographical region do your customers come from?

    We’ve covered this point in an earlier discussion with Professor Anne-Wil Harzing. American companies generally get higher NPS results than Europeans – typically 10 points higher and often much more.

    2. Do you conduct NPS surveys by telephone or face-to-face or by email?

    In the UK and Ireland, we don’t like giving bad news – certainly not in a face-to-face (F2F) discussion. Even if we’re talking over the phone, we tend to modify our answers to soften the blow if the feedback is negative. Result: scores are often inflated. In our experience, online assessments give more honest results but can result in scores 10 points (or more) lower than in telephone or F2F surveys. This gap can be smaller in countries like the Netherlands, Germany and Australia where conversations tend to be more robust. It’s a cultural thing.

    3. Is the survey confidential?

    Back to the point about culture – it’s easier to give honest feedback if you can do so confidentially. This is particularly the case if the customer experience has been negative or if you have a harsh message to deliver. Surveys that are not confidential tend to paint a much rosier picture than those that are confidential.

    4. Is there a governance structure in place?

    At Deep-Insight, we advocate a census approach when it comes to customer feedback. Every B2B customer above a certain size MUST be included in the assessment. No ifs or buts. Yet we are often amazed by the number of companies that allow exceptions. For example: “We’re at a sensitive stage of our relationship with Client X so we’re not going to include them”. In many cases, it’s more blatant. Clients are excluded because everybody knows they will give poor feedback. A proper governance structure is required to ensure ‘gaming’ is kept to a minimum. This gives the survey process credibility.

    5. Is the survey carried out by an independent third party, or is it an in-house survey?

    In-house surveys can be cost-effective but suffer from a number of drawbacks. The main drawback is that they generally result in inflated scores. For starters, in-house surveys are rarely confidential and are more prone to ‘gaming’ than surveys run by an independent third party. We have seen cases where in-house surveys have been replaced by external providers and the NPS scores have dropped by a whopping 30 points or more. Seriously, the differences are that significant.

    So what is a GOOD NPS score for B2B companies?

    Now, let’s get back to the question of what constitutes a good B2B Net Promoter Score. Here’s our take on it.

    Despite the claims that one hears at conferences and on the Internet that “we achieved +62 in our last NPS survey”, such scores are rarely if ever achieved. We’ve collected NPS data for B2B clients across 86 different countries since 2006. Our experience is that in a properly-governed independent confidential assessment, a Net Promoter Score of +50 or more is extremely rare. Think about it. To get 50, you need a profile like the one below, where a significant majority of responses are 9 or 10. In Europe, that simply doesn’t happen.

    B2B Net Promoter Score
    Our experience of B2B assessments is that A NET PROMOTER SCORE OF +30 IS EXCELLENT and generally means you are seen as ‘Unique’ by your customers.

    A NET PROMOTER SCORE OF ABOUT +10 IS PAR FOR THE COURSE. Consider +10 to be an average NPS score for a B2B company in the UK or northern Europe.

    Note that negative Net Promoter Scores are not unusual. Approximately one third of Deep-Insight’s B2B clients have negative scores. One in 10 has a score of -30 or even lower.

    Benchmarking

    One final comment about benchmarking. Deep-Insight’s customer base is predominantly northern European or Australian. However, many of our clients operate in eastern or southern Europe – and in Asia or North America. We need to be careful about how we benchmark different divisions within the same company that are in different regions.

    In our opinion, the best benchmark – for a company, business unit or division – is last year’s score. If your NPS is higher this year than it was last year, then you’re moving in the right direction. And if your NPS was positive last year, and is even more positive this year, happy days!

    * Net Promoter® and NPS® are registered trademarks and Net Promoter SystemSM and Net Promoter ScoreSM are trademarks of Bain & Company, Satmetrix Systems and Fred Reichheld