What Does Net Promoter Score Actually Measure?

What Does Net Promoter Score Actually Measure?

Interview with Professor Nick Lee

Some weeks ago, I met Nick Lee, Professor of Marketing at Warwick Business School to discuss his views about Net Promoter Score (NPS)I specifically wanted to get Nick’s views on NPS as a measurement tool. Does it work? Is it linked to sales growth? What does Net Promoter Score even measure?

Professor Nick Lee

Nick has an impressive background. In fact, The Academy of Marketing has already honored him with Life Membership in recognition of his outstanding lifetime research achievements and contribution to marketing scholarship. He is currently the Editor-in-Chief of the Journal of Personal Selling and Sales Management (JPSSM), which is the premier journal for research in professional selling. He is the first UK academic to hold this position, and only the second ever from outside the US. Nick was also the Editor in Chief of the European Journal of Marketing from 2008-2018. 

Nick is more than just an academic. He holds strategic advisor positions for a number of innovative sales and leadership development companies, and he was part of the All Party Parliamentary Group inquiry into professional sales in 2019. His work has been featured in The Times, the Financial Times and Forbes, and he has appeared on BBC Radio 4, BBC Radio 5Live, and BBC Breakfast television. 


Net Promoter Score: 20th Birthday

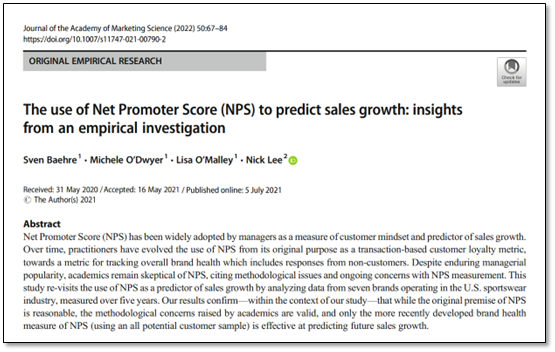
What prompted me to interview Nick Lee was a recent academic paper he was involved in called “The use of Net Promoter Score (NPS) to predict sales growth” which was published in the Journal of the Academy of Marketing Sciences (JAMS) in 2022.

Our discussion was very timely as Net Promoter Score is a metric that was invented by Fred Reichheld, a partner at Bain & Company, 20 years ago this year

Over the past two decades, NPS has divided opinions. While it has been embraced enthusiastically by many businesses, it has been shunned by others. The academic world has questioned what Net Promoter Score actually measures.

I think you’ll find Nick’s comments on Net Promoter Score and what it really measures quite fascinating because he doesn’t hold back from his criticism of NPS but also points out that the flaws don’t invalidate its usefulness as a measurement system, as long as it’s used in the right way: tracking changes over time, rather than simply chasing a number


The Interview

John:

Good morning Nick. To start, could I ask you to tell me a little about your own academic background. What was your first interest in the field of marketing?

Nick:

Well, I began my academic career as a doctoral student in marketing strategy. It seemed to me that the connection between sales and psychology was quite important. And there was a lot of work in management that was related to psychology, but very little of that research had been focused on the sales force.

A lot of sales research is actually about things like incentive structures and territory design. I call that ‘technical management’ but what I was more interested in was not so much the decisions that managers made, but how they implemented those decisions. Sales management is more about psychology than a mathematical or technical thing. More recently, we’ve seen how digital transformation has led to a a merging of the ‘technical’ things with the more psychological things, and that’s really the space I operate in now.

Is NPS a Fundamentally Flawed Metric?

John:

So let’s talk about the psychology of Net Promoter Score. It’s clearly a sales and marketing concept. It’s also a performance metric. When did you start getting involved with Net Promoter Score and is it a good sales and marketing measurement tool?

Nick:

My interest in NPS really came from Sven Bähre and that paper we wrote called The use of Net Promoter Score (NPS) to predict sales growth. Sven drove that project while my role was to use that project to address something that was important to the marketing literature. And I think it is very interesting that academia’s gone down one road with Net Promoter Score, the very simple road which says “NPS is useless and a load of rubbish”.

At the same time, business practice has completely ignored that academic view. Net Promoter Score has become the dominant customer metric in business. It feels like someone has to be right and someone has to be wrong here. But the interesting thing is it turns out that both sides are right. They’re just talking about different things. And that’s what fascinated me.

John:

So tell me about those different things. When I looked at Net Promoter Score many years ago, a guy called Tim Keiningham – one of the people you refer to in your paper – was very critical about NPS as a metric. At the time he worked at Ipsos so I wondered if he was bringing his own biases to the table. But at the same time, he was saying that the data did not show any link between NPS and sales growth.

Nick:

Oh, that’s interesting about Keiningham, I didn’t know that he was at Ipsos then. So there are a couple of issues that lead to this disconnect. One is that we generally don’t like it when a publication like the Harvard Business Review tells us there’s a single number that every company needs to look at. That automatically gets people’s interest and it actually didn’t make sense to me. 

The other issue is, and I have every sympathy with this view, is that Net Promoter Score doesn’t really measure what it claims it measures. There are so many potential flaws in the idea that this one number could be a valid measurement of anything real. I spend a lot of time trying to develop measures around attitudes and psychological concepts. And this is a classic example of a metric that doesn’t seem to actually ‘measure’ anything. So on that basis, it is quite flawed.

When you add in the idea that you have to subtract the bottom scores (Detractors) from the top scores (Promoters), you're torturing the measure to within an inch of its life.


What does NPS Actually Measure?

John:

Surely Net Promoter Score is a measure of advocacy, if nothing else?

Nick:

To some extent it taps into advocacy, sure. However, it’s a number in response to a single question that doesn’t take account of all kinds of other factors that might be relevant. And then you have this weird calculation for subtracting ‘Detractors’ from ‘Promoters’. As a mathematical construct, that’s not great. But the real issue is that advocacy is a much more complicated idea and can’t really be accurately captured by a response to a single question.

So there’s no real evidence that that answer to the NPS question is a reliable measure of advocacy. And then when you add in the idea that you have to subtract the bottom scores (Detractors) from the top scores (Promoters), you’re torturing the measure to within an inch of its life. At that point, it ceases to become a measure anymore, even if it was at the beginning. It becomes a number which is divorced from the underlying concept.

John:

I’m with you. But does that invalidate it completely as a measure?

Nick:

Well, here we get to the bigger question: rather than “is NPS a measure”, we need to ask “is NPS actually useful?” In academia. we’ve said nothing about NPS for the last 20 years apart from “it’s crap”. But when I see a whole bunch of senior executives in large companies saying “well, I’m finding a use in it”, then academia needs to look at that.

What’s my conclusion? I think that is a problem for academia insofar as we tend to talk past each other in a lot of areas. We have to provide some insight into what practitioners are doing in this field. Of course, it’s our sole driving force as a discipline to find out what practice is doing and we study that. But at the same time, it is worth studying if the entire business community is using something that 20 years ago we in academia said was wrong. 

John:

Have you come to any conclusions as to why senior leaders use Net Promoter Score, or how they can use it more effectively?

How Should NPS be Used?

Nick:

One reason why it’s used so much is partly a self-fulfilling prophecy. It’s used because everyone uses it and therefore nobody wants to not have that information. That’s an important factor.

But then the other aspect is that it’s used because it’s simple. It’s easy to collect and it’s simple to use. Whether it’s easy to interpret is actually a more challenging question. I don’t think it is that easy to interpret. For starters, what does the NPS number actually mean at any given point in time?

Now when you start tracking NPS over time, those questions fall away because what you’re looking at is trend data. What was it last year? Is it up or is it down? You have to operationalise NPS in the right way – by tracking the change in NPS score from one period to the next, not the absolute score. That’s important.

Net Promoter Score is also influenced by a lot of transient factors. For example, it’s very easy to manipulate and there’s a big selection bias. Who is asked to complete the NPS survey? Also, every surveyor cannot help but lead the customer on towards a higher NPS score. So at any given point in time, the net promoter score doesn’t mean much because of that selection bias. But if you assume that those forces are broadly the same over time, you can extract that little bit of signal from that noise with the time series a little bit more effectively than at a single point in time.

John:

I’m with you. But in our experience, the level of bias can increase over time. So you need to have a governance structure to ensure consistency. Or indeed, you may need to break the system apart and start again if the ‘gaming’ gets too deeply ingrained.

We should track trends, not individual time points. And the more data we have, the better. More bad data isn't better than less good data. But more flawed data is probably better than less flawed data.

Nick:

Yeah, I think you’ve got it right there. It is important not to be naïve that over time there might be an ‘instrument effect’ or a ‘history effect’ where people learn how to better game the system. I think with something like Net Promoter Score, that’s less of a thing because it’s pretty easy to know how to game the system straight away. And the only thing you can do really is try to say to your customers: “this is really important to me, can you please leave me a good score?” And there’s only so convincing you can be there. It’s not like you’re going to get better at doing that after a certain point in time. So I would be less worried about that.

But of course there are always ways to game the system. But the point is we should track trends and not individual time points. And the more data we have the better. Of course more bad data isn’t better than less good data. But more flawed data is probably better than less flawed data. So given we assume the data is flawed all the time, the most important thing is to know how that data is flawed. And while you can never perfectly extract the signal from the noise, the signal is there if you have enough data points gathered over a sufficiently long period of time.

Where Do We Go From Here?

John:

So where do we go from here, and where should academics be focusing their efforts?

Nick:

A few things for us to work on. First is international comparability. Big multinationals use Net Promoter Score across their different national areas. And I would imagine they’re comparing EMEA with America with Australasia. Is NPS really able to support that comparison? That’s a challenge so that’s the first thing I would look at.

Second is to move away from a single question. We really need multiple measures in order to compare them statistically across different cultures. So Net Promoter Score is one item. You would like it to be three or four items. And then you could compare those items across countries.

A third area is to get a wider industry perspective. We looked at NPS in a branded consumer goods context: sportswear. Is it equally useful across all kinds of different industry sectors? Particularly if you look at the service sector and front line services, which are linked to business to business (B2B) personal selling. Is NPS a useful metric for these interpersonal interactions? How well does it work in a B2B setting?

John:

Nick, I really appreciate your time today. I’m looking forward to seeing more research into Net Promoter Score. From a selfish perspective, I’d particularly like to see some B2B research done as there’s very little out there that I can find on the topic. Thanks again, Nick.

Kainos, Revenue Growth & Net Revenue Retention

Kainos, Revenue Growth & Net Revenue Retention

Kainos, Revenue Growth and Net Revenue Retention

What Drives Revenue Growth?

For much of 2022, I’ve been discussing the topic of revenue growth with senior executives of B2B companies.

What drives it? What capabilities do companies need for growth? Is Net Revenue Retention (NRR) a good predictor of profitable growth? If not, what is? 

One of the most interesting discussions I had was with Brendan Mooney, CEO of IT services company Kainos. The reason I was keen to have a chat with him should be clear when you look at the table below.

Table 1. Revenues at Kainos, excluding acquired companies (£m, 2015-2022)

Kainos Revenue

NRR Explained

Net Revenue Retention is not yet a commonly-used financial term in business even though it is a well-known term in Software as a Service (SaaS) companies.

Let’s look at Kainos’ revenues from a NRR perspective. Let’s group revenues by the year in which they were acquired.

The graph on the right shows that in 2015, Kainos generated revenues of £61m.

Now suppose Kainos signed up no new clients in 2016. Its revenues would still have grown as the clients that were on its books in 2015 generated revenues of £68m in 2016.

Here’s the NRR calculation:

Kainos’ Net Revenue Retention for 2016 is:

NRR = £68m ÷ £61m = 111%

Kainos NRR net revenue retention


NRR At Kainos

Kainos may not be a household name but since it floated on the London Stock Exchange in 2015, it has been growing revenues organically by 20-30% a year. That’s 20-30% a year every year. Without fail. How many companies can claim revenue growth like this over the past eight years? 

I certainly know of very few companies with such a track record. Some of our own clients at Deep-Insight are struggling to achieve any organic growth at the moment. So that’s why I wanted to talk to Brendan. I was really curious to find out how Kainos achieved such consistent growth. What was their secret sauce?

It turns out that the real secret to Kainos’ phenomenal growth is their great Net Revenue Retention (NRR) rates but, more importantly, those NRR figures are the outcome of consistently excellent service delivery for their clients.

Large B2B companies with NRRs consistently above 100% can be considered ‘very good’. Any company with an NRR above 110% should be considered as ‘excellent’. Brendan Mooney sets the bar higher and believes you need an NRR of 115% to be considered ‘Best in Class’.

Kainos is a high growth, high profit company precisely because its NRR figures are so strong. In its eight years as a publicly-quoted company, its NRR has only once dropped below 100%. In 2019, it hit 139%. Kainos is certainly ‘Best in Class’ and is a role model for any company trying to achieve above-average revenue and profit growth.

NRR is not a difficult concept to grasp but few senior executives truly understand the power of monitoring their company’s NRR performance. The reason for this is that most B2B leadership teams don’t understand how much it costs to land a ‘Net New’ client (brand new logo). If they did, they would become obsessed with retention in general, and NRR in particular as a key metric to monitor.

Which is More Important: Land, Expand or Retain?

Many companies grow revenues by investing heavily in new sales. It works. But it’s expensive – much more expensive than people think. Our analysis at Deep-Insight shows that it typically takes 4-6 years to break even when you sign up a new client. If CFOs and leadership teams measured Customer Lifetime Value (CLV) – and most don’t – they would realise that a significant proportion of their clients never make a profit. The reason? They don’t hang on to those clients long enough for them to pay back the acquisition cost and break even.

In some cases, a company’s ability to Land a large number of ‘Net New’ clients each year can mask a failure to Expand its footprint across those accounts, and/or a failure to Retain those clients over the longer term. 

Companies can grow revenues by investing heavily in new sales but it’s difficult to stay profitable if all you’re doing is replacing existing clients with expensive new logos, many of which never stay around to generate a profit. 

So why is NRR so important? The answer is that you can achieve growth with an NRR performance well below 100% but it’s rarely sustainable. Profitable growth always trumps revenue growth. Expanding and Retaining are far more important activities than Landing.

Who Needs New Clients Anyway?

Here’s another thing: if your NRR is consistently above 100%, you don’t need ANY new clients to grow your business.

Just think about that for a minute. I’ve said that it’s expensive to acquire a new client in the first place. It’s not just the cost of the salespeople who win the bid. You also have to factor all the time and money they spend on bids that they DON’T win. 

We’re not suggesting that companies disband their sales teams. We are suggesting that they become much more discerning in what they bid for, and once they sign up a ‘Net New’ client, they need to organise themselves to retain those clients for, well, pretty much forever. They also need to figure out a good strategy for expansion across that account – finding additional products and value-added services to cross-sell.

And that’s what Kainos does really, really well.

From Campus Company To FTSE 250 Star

Let’s get back to Brendan Mooney and Kainos. Brendan joined the company as a trainee software engineer from Ulster University in 1989. 

At the time, Kainos was a small university campus company with around 25 employees. It was a joint venture between Fujitsu and Queens University, Belfast. Most of its work was for Fujitsu in Great Britain. Brendan was one of two graduates hired from Ulster University that year. Both still work at Kainos, which might give a hint at why the company has been so successful over the years.

Brendan started working in Dublin in 1994 as Kainos started to expand its footprint across the island of Ireland. In 2001, he took over as CEO. Roll forward a few years. In 2015 Kainos floated on the London Stock Exchange. Today it is a constituent on the FTSE 250 Index. 

I asked Brendan why Kainos was not as well-known as other IT service providers, despite its hugely impressive track record. His answer was simple: “We do our best marketing by delivering for our customers”.

In terms of brand awareness, our customers – and those who we want to do business with – know us quite well. We’re also probably well-known inside universities because that’s our heritage and where we target students for recruitment. But yeah, I guess we don't have a particularly high public profile.

The thing is that we do our best work by delivering for our customers. That’s where we put our energy and enthusiasm, and that gives us the results and recognition we’re looking for. For us, it’s all about the ongoing relationship with our customers.


Engage, Deliver, Grow

When I talked to Brendan Mooney about Landing, Expanding and Retaining clients, he said he preferred to use a different phrase: Engage, Deliver, Grow

His explanation goes to the heart of the NRR/Growth challenge, and it’s a hard-nosed commercial view. Kainos is very focused on profit margins – particularly where there a likelihood of margin erosion. In Brendan’s view, the best way to hold profit margins and reduce erosion is to manage Engagement Efficiency. Here’s how he defines it:

So you've made promises during the sales campaign. Now you have to deliver against those promises and commitments. And if I think about profit margins in a contract, there are three points of margin erosion in a ‘Net New’ client – three areas where you incur additional costs or give away margin.

COST NUMBER 1 is the cost of a sales team. Good salespeople are well paid. They have a pre-sales team that supports them. They don't win every bid. There's the lost business cost you need to factor in as well. So that's cost number one.

COST NUMBER 2 is competitive pricing. For a ‘Net New’ client, it’s typically a competitive bid. It doesn't matter how disciplined you are as a sales professional, your instinct will be to price more keenly than the competition in order to win. The client will always tell you price is a problem, and you know it’s going to be part of the conversation with a professional procurement team...

But actually, COST NUMBER 3, which relates to ‘Engagement Efficiency’, is the key one. That’s what drives our view about the reciprocal nature of a long term relationship. Because we've had a significant cost in winning that client, we want to see that client retained 15 or 20 years, obviously even longer. Then what do you do? You put a really strong team on that first engagement. When you start any new project, you don't know the client very well. But are they sure about their outcome they're trying to achieve? How competent are they as an organisation to deliver their part of the overall project plan? And if they're using third party suppliers, how responsive will they be in that project? We can't control all those factors but we can control the quality of our people. So we put on a very experienced team for that first engagement to provide us some degree of flex, in case anything happens, which it usually does.


In summary, Kainos stacks the initial engagement with very experienced people. That’s precisely because Brendan Mooney knows that if something can go wrong in those initial months, it probably will. Kainos needs experienced people to be able to handle all eventualities and still deliver a really successful Phase 1 of the engagement.

Once that initial phase has been delivered, Kainos can change the mix on the project team. But that initial phase is crucial to build Kainos’ reputation. It will build the trust their clients have in Kainos as an organisation and as a true business partner. 

Get the Engage and Deliver elements right and the Grow piece becomes a lot easier.

Getting The Balance Right

And if it sounds like Kainos is purely a company focused on numbers and profit margins, it’s not. Brendan Mooney was quick to point out that “it’s all about balance”

As a business, Kainos sets out three ambitions, all of which are important, but they do have a priority order.  These are, in priority:

  1. Being a great employer
  2. Delivering value to our customers 
  3. Being a growing, profitable and responsible business

The apex of Kainos’ pyramid is its people. It works hard at keeping the talent that it has, as well as attracting more great people.  Unlike its NRR rates, Kainos can’t achieve a people retention figure of greater than 100% but its current figure of 86% compares well against the market.

Growth = Consistently Good Service Delivery

When it comes to that third point about growth, Brendan’s philosophy is simple: “If you want to build your business, keep your current clients. Then you can expand in terms of the other share of their expenditure. That’s our thought process.”

And at the heart of that philosophy is a drive and obsession with delivery excellence. Consistently good service delivery helps build trust and commitment and those elements are the key to any long-term business partnership.

I joined an organisation that was young but had a very mature view about delivery. And it was about the premise that if you delivered to your client and you helped them achieve their business objectives, then they would come to you in the future to place business with you.

For us, it's all about delivery – I can't explain it another way. So it's not a complicated concept at all. But the important thing here is the delivery.

Our sales team will always point out that the reason we won that bid was because of our delivery reputation. The reason we won a DEFRA contract for £54 million was that we did Phase One so well that the client was just blown away.

Or the reason that we had a £92 million contract with the Passport Office in the UK was that for the previous four and a half years we had managed to beat every single deadline they'd set into their plan.

And we're easy to work with – that's important too. But if you don’t have that delivery capability, it’s so much harder for any sales or account manager to win. And again, it's a community that self-references quite quickly.

The UK is a bigger place than Ireland, but it's not an enormous place. People will be able to find out about you quite quickly, if you fail to deliver a project.


Key Takeaway

In my interview with Brendan Mooney, we covered a few other topics as well. We talked about how it wasn’t all plain sailing, particularly during the banking crisis in 2008 when many of Kainos’ clients were financial services companies; how they diversified into international markets and made the strategic move to start supporting Workday clients; and the more recent move into digital transformation and agile software development practices. 

However, the key takeaway from my interview with Brendan Mooney was this: If you want to grow revenues consistently over time, you need to have a really well-structured approach to engaging with the right clients, and then delivering the goods for them time after time after time.

It’s not rocket science. But that doesn’t mean that it’s easy.


How Do You Measure B2B Customer Experience?

How Do You Measure B2B Customer Experience?

B2B Customer Experience

A lot of words have been penned on the topic of customer experience (CX) in recent years. But here’s the thing. Most of what’s written relates to CONSUMER experience.

There really is very little out there about CX purely written from a business-to-business (B2B) perspective. That’s really surprising when you consider that B2B commerce is significantly larger than its business-to-consumer (B2C) counterpart.

So let’s try to redress that with this blog. Let’s explore how CX is, and should be, measured in B2B companies. 

The answer to the first question is easy. Most large B2B companies use Net Promoter Score these days. The second question – how should CX be measured – is harder to answer. There are other measurement systems out there so is NPS really the best metric? Does it even work in a B2B context? 

What is Customer Experience anyway?

Before we answer these questions, I need to provide a little bit of context to how we got to where we are today. The reason is that the term ‘Customer Experience’ is actually a very recent term. As the Box below shows, the term was first coined in 1999.

‘Customer Experience’ was called something else for most of the last century. In fact, CX was called a lot of different things over the last 100 years. 

Professor Saba Fatma traces the term Customer Experience back to a 1999 book by Joe Pine and James Gilmore called The Experience Economy: Work Is Theatre and Every Business a Stage.

The book itself starts with a wonderful example of how the value in a cup of coffee is in the experience, rather than the quality of the underlying commodity (in this case, the humble coffee bean).

This example above is from the consumer, or B2C, world but the concept is equally applicable to the B2B world. Experiences are subjective. They tap into the emotional as well as the rational side of the brain.

Price of Coffee How Should You Measure B2B Customer Experience?

A Brief History of CX in the 20th Century

So if CX is a term that only came into common usage at the turn of the 21th century, what was it known as before then? Time for a short history lesson.

A hundred years ago, there were practically no formal customer-related performance measures in existence. That’s not to say manufacturing companies didn’t think about the customer. And it was all manufacturing back then. The services economy didn’t really take off until much later. In fact, it was only after the end of the Second World War that services became the dominant component of western economies. The graphic below shows that in the UK, the services sector hit 50% in 1950. Today, it’s closer to 80%.

UK Economy How Should You Measure B2B Customer Experience?

Back in the 1950s, it made sense to focus on product quality. By then, management gurus like W. Edwards Deming, Joseph Juran, and Philip Crosby were rolling out a series of techniques and approaches for Total Quality Management, or TQM. That’s what customer experience was all about in those days.

By the 1960s, management theory had become a little more sophisticated. People started thinking not just about the quality of the product being manufactured, but also about whether the customer was satisfied with the product. Did it meet expectations? Did it exceed expectations? This is when Customer Satisfaction, or CSat, measurement started to take off.

It’s strange to think that this was the first time that management gurus started thinking explicitly about the customer. 

By the 1980s, most economies in the world were dominated by services rather than by manufacturing. Service Quality became a fashionable, if fuzzy, topic led by American academics like Valerie Zeithaml and Leonard Berry. They proposed measuring concepts like reliability, responsiveness and customer care.

It wasn’t until the 1990s that people like Fred Reichheld (the guy who later came up with the concept of Net Promoter Score) really started thinking about the value of a customer over the lifetime of that person buying from a company, rather than just the value of the individual transaction. Customer Loyalty became the new buzzphrase. Reichheld’s book The Loyalty Effect is still one of the most sought-after management books of the last 30 years.

Also in the 1990s, another couple of American academics Morgan and Hunt came up with their views on the critical role of Trust and Commitment in business relationships. I’ve written about Morgan and Hunt before, in this blog.

Standing on the Shoulders of Giants

While CX is only a little over 20 years old as a concept, it is in fact built on a series of measures going back as far as the 1950s. Here’s the important thing. All of the concepts and measures in the following table are STILL relevant today. Fred Reichheld’s Net Promoter Score may be the most commonly used metric at the moment, but it’s not the only one. It’s not even the best one. But, in its favour, it is a simple concept to understand and equally simple for leadership teams and boards to implement. 

ERA

MEASUREMENT

1950s & 1960s

Total Quality Management (TQM)

1970s

Customer Satisfaction (CSat)

1980s

Service Quality

1990s

Customer Loyalty

Trust & Commitment

2000s

Customer Experience (CX)

Customer Experience Management (CEM)

Net Promoter Score (NPS)

When CX met NPS in the early 21st century, it seemed a marriage made in heaven. If the customer experience was excellent, we could measure just how good it was by asking a very simple question: “Would you recommend it?” NPS turned out to be a really straightforward way to measure consumer experience.

But is NPS a good metric to measure B2B customer experience? After all, the business world has had nearly a century of research into product quality, satisfaction, service quality, customer loyalty and business relationships. Should all these metrics be cast aside in favour of NPS?

As Isaac Newton famously said to a letter to Robert Hooke in 1675: “if I have seen further, it is by standing on the shoulders of giants.” CX professionals need to do the same when they consider what metrics to use in the B2B world. By all means, use NPS as a key metric. But also look back to the giants of the 20th century for inspiration.

Measuring B2B Customer Experience – is NPS Enough?

In short, No! 

Fred Reichheld’s Net Promoter Score may be a great metric for measuring advocacy and is well suited to consumer environments and brands. Don’t get me wrong – it also has applicability in B2B environments even though I haven’t always been a fan.

The great strength of NPS – its sheer simplicity – also turns out to be its main failing.

Everybody understands intuitively the concepts of ‘Promoters’ and ‘Detractors’. They also grasp the ‘net’ concept. In other words:

          NPS = % Promoters minus % Detractors

Boards and leadership team love the fact that it works on all types and sizes of customers. It’s easy to administer as it’s a single question. But therein lies the problem. It’s a single question. It’s very one-dimensional. It ignores all the giants of the 20th century and the work they did to understand what customer experience really involves, and how best to measure it.

NPS tells you whether you have a problem or not. It doesn’t give you the deep insights you need in complex B2B environments about the nature of the underlying problems. Or how to fix them.

Customer Relationship Quality (CRQ)

The answer to the question at the top of this blog – how should you measure B2B customer experience – is to combine the best of all worlds. To stand on the shoulders of the giants of the 20th century. And to do so in a pragmatic way.

The Net Promoter question is worth asking, but in conjunction with a handful of other questions that are built on a foundation of nearly a century of good research. The result is a methodology that we call CRQ – Customer Relationship Quality – which covers six building blocks:

The approach we take at Deep-Insight is to stand on the shoulders of giants such as Deming, Juran and Crosby way back in the 1950s. I’ll come back to this topic again in the near future as I believe one of the most fundamental building blocks on customer experience for any B2B organisation is consistently good service delivery. Our own research shows that service delivery is the most important driver of long-term trusted relationships.

If you’re interested in finding out a bit more about customer experience and how to measure B2B customer experience, download our white paper by clicking on the image below.

Alternatively, give us a call to have a chat.

You Said, We Listened

Last month, we asked our clients what they thought of us. We do this every year and take our Customer Relationship Quality (CRQ) feedback seriously. We try to follow the advice we give to our own clients: give your customers the opportunity to tell you what they think. Listen to what they say. Then act on their feedback.

As we did last year, we cast the net for our 2022 CRQ assessment quite wide. We didn’t just limit the survey to a handful of key decision makers in current clients. We included many operational and administrative contacts. Their views are equally important. We also asked dormant customers what they thought of us.

Last year, you said…

The main message that you gave us last year – actually for the last two years – was that you needed more than just a survey provider. In practice, that meant providing more assistance AFTER your customers gave their feedback. You needed a partner that could help you deliver meaningful change across your whole organisation. You also wanted us to be more flexible and supportive.

We listened, and here are three of the things we did in response to your feedback.

1. Deliver more than just a survey

We have always strived to be more than just a survey company. Our mission is to help companies become truly customer-centric. Getting customer and employee feedback is part of that process, but there’s much more to it than launching a survey. That’s why we completely redesigned the way we work with clients, based on what you said to us.

Today we spend a lot more time with leadership teams and sales or account teams both BEFORE we think about asking our customer’s clients for their views as well as AFTER they give their feedback. The BEFORE piece is critical and must be done properly. If you don’t invest the time up-front, your CX (or EX) programme will not deliver the results that Management and the Board expect from it. More than likely, it will end in failure. It’s as simple as that.

2. Assist with Customer Relationship Quality ‘Healthchecks’

Last year we conducted CRQ ‘Healthchecks’ for clients in the UK and Ireland. The objective of a ‘Healthcheck’ is to benchmark how good a company’s Customer Experience or Customer Satisfaction programme is. That doesn’t just mean assessing if the right questions are being asked of the right people. It’s a more fundamental look at whether all the right components are in place to deliver genuine and meaningful benefits. We do this under four headings:

1. LEADERSHIP. The most important quadrant. Good Customer Excellence (CX) programmes are ALWAYS led from the top
2. STRATEGY. Good CX programmes link customer, product, operational and organisational strategy explicitly to customer needs
3. EXECUTION. Success requires properly resourced teams that are brilliant at executing the Strategy
4. CULTURE. Finally, Customer Excellence must become integral to the DNA of the organisation: “it’s how we do things around here”

All four quadrants are necessary for a successful CX programme. The ‘Hard Side’ quadrants of Strategy and Execution are all about metrics and processes. ‘Hard Side’ activities lend themselves to key performance indicators (KPIs) and while the activities in these two quadrants are important and easily measurable, the quadrants of Leadership and Culture are actually more critical.

In our experience, Leadership is the most important quadrant while Culture is the most challenging. And yet, here’s the strange thing: in most CX programmes the ‘Soft Side’ is often overlooked and almost always under-resourced.

3. Run Customer Centricity ‘Masterclasses’ for managers and leadership teams

One of the key ‘Soft Side’ challenges is making sure your entire organisation is on board with your CX (or CSat or NPS or Customer Relationship Quality) programme. Over the past 12 months, we have partnered with the world-leading HEC Business School in Paris.

That collaboration has helped us develop and deliver a ‘Masterclass’ to educate leadership teams, managers and partners about the importance and benefits of putting the customer at the heart of everything they do. The ‘Masterclass’ also helps employees understand the crucial role they play in making their companies customer-centric.

Already, these ‘Masterclasses’ have been delivered both virtually (for COVID reasons) and face-to-face to clients in Europe, Asia and the Americas.

How did we score this year?

Having made the investments over the past two years, we were very curious to get your reaction. In short, you were very generous in your responses this year.

This year we achieved a Net Promoter Score of +66 and a Customer Relationship Quality (CRQ) score of 6.1 out of 7.

This is the highest NPS result we have ever achieved to date and the third time we have scored over +50. Our CRQ score is also the highest we have ever achieved and we are honoured to be thought of so highly by you, our valued clients.

Result: new client wins

I honestly believe that it’s because of the trust that our clients place in Deep-Insight that we have been able to announce some great new wins in recent months.

We have a 10+ year relationship with Atos but primarily in the UK & Ireland. Earlier this year, we extended that relationship to Germany and over the next three years we will be partnering with Atos on one of their most important and strategic global accounts.

One of our largest accounts in Australia was the logistics company Toll Group. Last year our key contact at Toll moved to Scotts Refrigerated Logistics and we recently signed a new 3-year contract to help ScottsRL become one of the most customer-centric companies in Australia.

Vreugdenhil Dairy Foods is a Dutch milk powder manufacturer that operates in Barneveld, Scharsterbrug, Gorinchem and Madrid. Its 500 staff process 1.4 billion kilograms of milk each year. Over the next three years, we will be working with the Vreugdenhil leadership team to turn a company that creates great food products into a truly customer-centric organisation.

Agenda for 2022

While we’re really proud of these Customer Relationship Quality (CRQ) and NPS scores, there is more to do.

For starters, we got feedback from 48% of the people we asked to participate. While that’s not bad, we do see some room for improvement. Last year our response rate was 55%. We know that some of our clients achieve rates of 70% or more. We will be working hard to improve on this figure next year.

Second, the main feedback we received this year is that our new consulting services are great BUT not enough. Our clients are looking for Deep-Insight to provide even more support. The two customer quotes below confirm to me that we need to support clients on a year-round basis.

“Would like to see greater insight on how we can really make a difference for our customers. How do we truly address those recurring themes that come up each year? It would be great to get insight on how we can do this better – beyond the data”

“I would question to what degree on a continual basis Deep-Insight provides interaction and insight as a partner to the business. Also, to what extent there are follow-up meetings post results as you as experts help inform our response and strategy.”


Third, the feedback process is not finished yet. We need to ‘close the loop’ with all clients and discuss their specific feedback. We will be in touch shortly and will be looking specifically for more insights into any additional support needs they may have.

I need to finish off by thanking Fiona Lynch for planning, organising and running this year’s client assessment. Fiona joined us earlier this year from Atos where she was part of a global service delivery team. It’s great to have her on board.

So, well done Fiona, and thank you to all of our clients. We really do value your feedback.

John O’Connor
CEO, Deep-Insight