How to Maximise Completion Rates for a CX Programme?

Setting up and running B2B Customer Experience (CX) programmes is our ‘bread and butter’ at Deep-Insight.

We’re used to handling questions on how to make CX programmes more effective. One of the most common questions we get from first-time clients is: “What completion rates can I expect from my CX programme?” Another common question from longer-term clients is “How do I improve my completion rates?”

Let’s deal with each question in turn.
 

“What Completion Rates can I expect from my CX programme?”

Let me preface this by saying that we are talking about business-to-business (B2B) relationships so there is an inherent assumption in the question that our clients have some existing – and hopefully strong – relationships with their customers and that these contacts will be receptive to a request to give feedback as part of that ongoing relationship.

This is usually the case but clients – particularly senior clients – are busy people so it may not come as a surprise to hear that the average participation rate in a B2B customer assessment is around 35%.

But that 35% figure is an aggregate score and there’s a little more to it than that, if you have a look at the graph below.
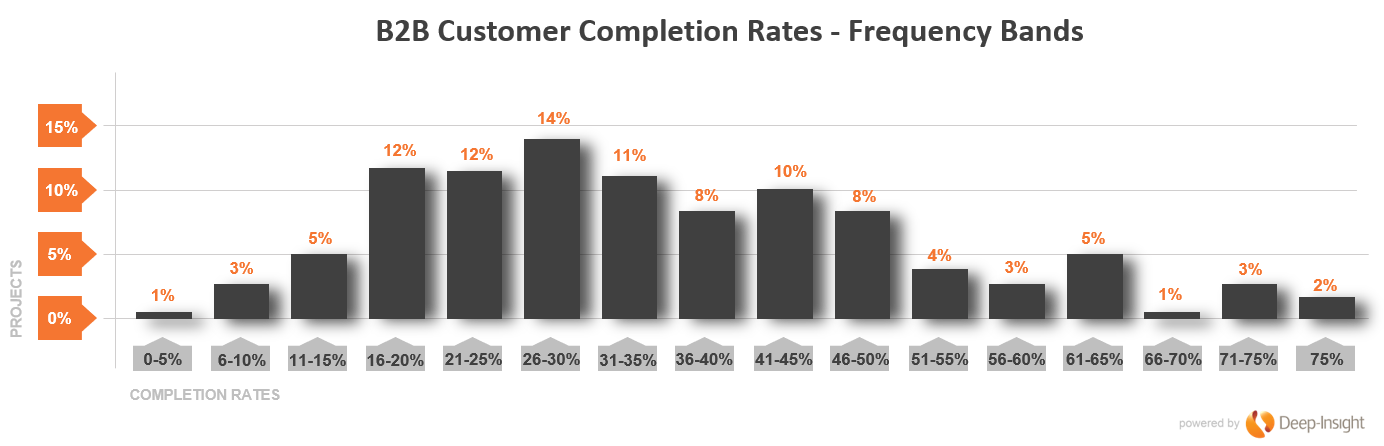
completion rates CX Programme
 

The spread is wide.

The most common completion rate is in the 26-30% range. We have a smaller number of clients – typically those who have been running our Customer Relationship Quality (CRQ) assessments for many years – who regularly achieve completion rates of 50% and higher.

If this is your first time running a customer assessment – either a simple Net Promoter Score survey of something a little more complex like our CRQ relationship assessments – you can expect completion rates of less than 1 in 3.

This may sound OK if you regularly run consumer surveys where a 5% completion rate can be a good result, but for an existing long-standing B2B client relationship, it’s paltry. And yet we have been running customer assessments of all sorts for nearly 20 years and these are the actual numbers.

So now let’s get to the second question:
 

“How do I improve my completion rates?”

The starting point is to understand why some B2B companies sometimes get really low completion rates and others consistently exceed 50%.

Our lowest-ever completion rate (4%) came from a first-time UK software client. The quality of contact data was simply terrible. We should have spotted that it was little more than a ‘data dump’ from the company’s CRM system. The list included people who had left their companies three years earlier. It included people who had never even heard of our client. It probably included the names of people who were dead. That’s because there was no governance in place for the programme. The Sales Director was not involved. Account Managers did not personally sign off the client contact names. You get the picture.

Our highest-ever completion rate came from a company that has been a client of Deep-Insight’s for 10 years and whose customers view the annual CRQ assessment as a critical part of their ongoing strategic partnership.

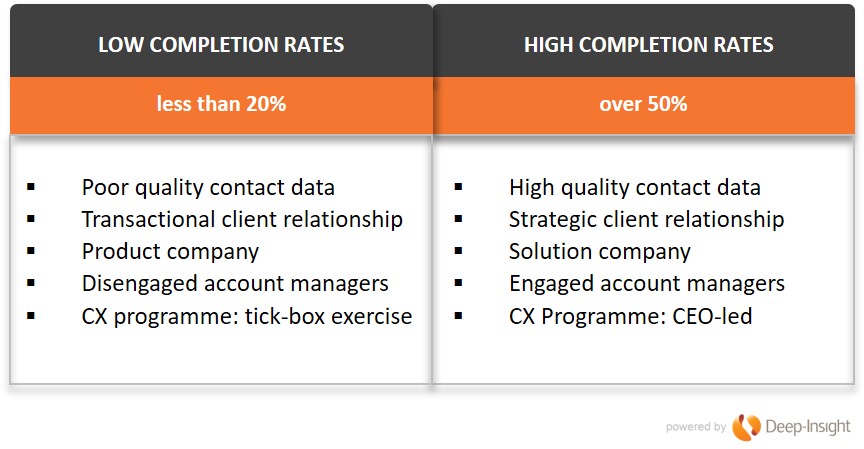
But there are other reasons for low and high participation rates. Here’s a quick summary of the profiles of our clients that fit into both categories:

completion rates CX Programme
 

6 Steps to Improve your Completion Rates

Here are the steps you need to take to get your completion rates up:

  1. Make It Strategic. If the CX programme is CEO-led and driven from the top, it will not be seen as another box-ticking exercise. Make sure this is a key item on the Executive agenda.
  2. Put in Governance Structures. By this we mean things like: a) Account Directors should supervise and sign all contact names, not just pull them from the CRM system; b) the Sales Director should personally sign off all Strategic Client contact names.
  3. Don’t call it a Survey! At Deep-Insight, we ban the use of the term “survey” . For us, a CRQ assessment is a strategic ongoing conversation with the clients and their views will be taken seriously.
  4. “Warm Up” the Contacts. An invitation to complete a survey should not come out of the blue. Ideally, it should be introduced by letter or by email by the CEO or Country Manager, and while an assessment is “live”, the account manager will know to stay in touch with the client and urge them to complete the assessment.
  5. Close the Loop. This is critical. If you ask for feedback, you need to share that feedback with the client, agree the actions that BOTH PARTIES will take to improve the relationship.
  6. Repeat. Get into a rhythm where your clients and your sales/account teams know that every February or October (or whenever), the annual strategic assessment will take place. You may want to run frequent assessments. Some companies have quarterly Net Promoter or Pulse assessments – but don’t overdo the frequency. Your organisation needs time to put remedial actions into effect.


Completion Rates of 90% or more?

Follow the above steps and you’ll get your completion rates to 50% or higher.

But remember that these completion rates are at an individual level. You should be getting feedback from multiple people at different levels within each client. Include Influencers and Operational Contacts as well as Key Decision Makers. That way you’ll get a wealth of information about what your key accounts REALLY think of you.

You’ll also get completion rates of 90% at an account level if you take this approach.

If you are interested in reading more about running a CX programme effectively take a look at our process for running a B2B CX assessment or just get in touch with us today for a chat.


Does NPS Work for B2B Companies
 

Help! What Do I do with my Stalkers and Opponents?

If you’re a typical B2B company, the chances are that you have good or excellent relationships with the majority of your clients. But you will also have clients where your relationship is not as strong. At Deep-Insight we help you understand these client relationships by segmenting them based on the strength of their relationship with you.

Here are the five categories we use:

Customer Relationship Quality – the Strongest Relationships

Ambassadors

The most loyal client category is the Ambassador segment. Ambassadors are your most valuable customers. They have a unique relationship with you and will recommend you to others. They are also prepared to pay a premium for your products or services – price is not an important consideration for them because of the quality of the relationship. Typically, a third of your clients are Ambassadors.

High Rationals

The next segment of clients are known as Rationals. They rate you positively but do not see anything unique in the relationship. Rationals will take their time to assess alternative sources of supply and the relationship can become unstable if good alternative offers exist. Typically, half of your key B2B accounts fit into this category. Generally they are good clients albeit not as loyal as Ambassadors.

The Weakest Relationships

But wait! That doesn’t add up to 100%. What’s the story with the others?

Well, the answer is that in all B2B account portfolios, there are clients that don’t love you that much. We typically find that 10-20% of accounts have poorer relationships with you and fit into one of the following three categories:

Ambivalents

Ambivalents often have a “love/hate” relationship with you. In some instances, they love the way you solve their problems but hate the way you treat them. More often, you are killing them with kindness but failing to solve their business issues. You may think the relationship is strong but you don’t really understand their issues and can’t propose business solutions to move their business forward.

Stalkers

Stalkers are often only interested in price. Sometimes they can be large corporate accounts looking for special offers and discounts. Other times, they are smaller accounts that view your services as poor value for money. Stalkers see nothing unique in the relationship and often have very high service requirements. They play different competitors against each other and do not generate a positive value for your portfolio.

Opponents have the poorest relationships with you. They are deeply dissatisfied and often highly frustrated by what they see as consistently poor service. Opponents have a negative relationship with the company and generate negative value. They can sometimes be won back if the reason for their dissatisfaction is identified and addressed but, in many cases, the relationship has broken down irretrievably and they can not be won back.

Managing Ambassadors

Before we look at how to manage Stalkers and Opponents – the main point of this blog – one quick point about how to manage Ambassadors. Ambassadors are willing to recommend you. So ask them for testimonials. Trustmary is a Finnish company that helps clients do exactly that using Net Promoter Score as the key metric for identifying Ambassadors.

Don’t be afraid to ask Ambassadors for testimonials or for introductions into other businesses. They want to help you. So just do it.

Managing Stalkers and Opponents

So what to do with these poorer-value relationships, particularly Stalkers and Opponents?

Three things:

1. Decide if you want to keep them or fire them

It may sound strange to talk about ‘firing’ clients but sometimes there are clients that can not be serviced effectively or profitably. Sometimes their expectations are too high, or the fit between their needs and your products or services is limited. In such cases, it’s valid to ask the question “Would we both be better off if we ended the relationship?” The big advantage about firing customers is that it frees up sales and account management time. This time can be used for more profitable activities such as cross-selling and upselling to Ambassadors, or for converting Rationals into Ambassadors.

2. If the answer is FIRE THEM, find a ‘beautiful exit’

Stalkers and Opponents have a corrosive influence on your company. They sap energy and consume resources that can be better used elsewhere. They also have a corrosive influence on other clients as they spread a negative message about your capabilities and services. Have that tough conversation with the client before the situation deteriorates, and help them move to a competitor. Do it cleanly and professionally. Find what Finnish Business Professor Kimmo Alajoutsijarvi refers to as a Beautiful Exit to the relationship – a disengagement that “minimises damage to the disengager, the other party, and the connected business network.”

3. If the answer is KEEP THEM, put a proper recovery plan in place

Many of Deep-Insight’s clients will put a Service Improvement Plan (SIP) in place for poor-scoring accounts, typically Opponents or Stalkers. These SIPs involve a significant increase in service support to that client. They also require an open and honest conversation between the Account Director and the most senior people in the client organisation. In large complex B2B client relationships, changes in behaviour are typically required on both sides to bring the relationship back on an even keel again. Don’t be afraid of saying to your client: “We’re committed to making improvements on our side, but we need you to do X and Y for this relationship to work.” (more…)

What is a Good B2B Net Promoter Score?

U P D A T E : We now have an updated analysis of what a GOOD B2B Net Promoter Score looks like. It’s based on data from 2015 to 2022.

* * * * * * * * * * * * *
So what is a GOOD B2B Net Promoter Score?

It’s a question we get asked a lot. Sometimes the question comes in slightly different formats. For example:

“What Net Promoter Score target should we set for the company?

“+25 seems a bit low, so maybe +50?”

“Or should we push the boat out and aim for +70?”

Well, it depends on a number of different factors. As we mentioned in an earlier blog, it can even depend on factors such as whether your customers are American or European. Seriously, that makes a big difference.

Customer at the Heart

What Factors Impact Your Net Promoter Score?

It’s crucial to understand how these various factors impact your overall Net Promoter Score. Your NPS result can be very sensitive to small changes in individual customer scores. Be aware of these factors when deciding on a realistic NPS figure to aim for. Most Europeans consider a score of 8 out of 10 to be a pretty positive endorsement of any B2B product or service provider. However, in the NPS world, a person who scores you 8 is a ‘Passive’ and therefore gets ignored when calculating the Net Promoter Score (see box below).

HOW IS THE NET PROMOTER SCORE CALCULATED?

For the uninitiated, a company’s Net Promoter Score is based on the answers its customers give to a single question:

“On a scale of 0 to 10, how likely are you to recommend Company X to a friend or colleague?”

Customers who score 9 or 10 are called ‘Promoters’. Those who score 7 or 8 are ‘Passives’ while any customer who gives you a score of 6 or below is a ‘Detractor’.

The actual NPS calculation is:

Net Promoter Score = Percentage of Promoters MINUS the Percentage of Detractors

Theoretically, companies can have a Net Promoter Score ranging from -100 to +100.

Here’s the thing. If you can persuade a few of your better customers to give you 9 instead of 8, then suddenly you’ve boosted your Promoter numbers significantly. We know more than a handful of account managers who carefully explain to their clients that a score of 8 out of 10 is of no value to them. If clients appreciate the service they are getting they really need to score 9 or 10.

Sure, there’s always a little ‘gaming’ that goes on in client feedback programmes, particularly when performance-related bonuses are dependent on the scores. However, we find it intriguing to see the level of ‘client education’ that account managers engage in when the quarterly or annual NPS survey gets sent out!

Five Key Factors

We said at the outset that the Net Promoter Score you achieve is dependent on a number of factors. Here are the five key factors:

1. Which geographical region do your customers come from?

We’ve covered this point in an earlier discussion with Professor Anne-Wil Harzing. American companies generally get higher NPS results than Europeans – typically 10 points higher and often much more.

2. Do you conduct NPS surveys by telephone or face-to-face or by email?

In the UK and Ireland, we don’t like giving bad news – certainly not in a face-to-face (F2F) discussion. Even if we’re talking over the phone, we tend to modify our answers to soften the blow if the feedback is negative. Result: scores are often inflated. In our experience, online assessments give more honest results but can result in scores 10 points (or more) lower than in telephone or F2F surveys. This gap can be smaller in countries like the Netherlands, Germany and Australia where conversations tend to be more robust. It’s a cultural thing.

3. Is the survey confidential?

Back to the point about culture – it’s easier to give honest feedback if you can do so confidentially. This is particularly the case if the customer experience has been negative or if you have a harsh message to deliver. Surveys that are not confidential tend to paint a much rosier picture than those that are confidential.

4. Is there a governance structure in place?

At Deep-Insight, we advocate a census approach when it comes to customer feedback. Every B2B customer above a certain size MUST be included in the assessment. No ifs or buts. Yet we are often amazed by the number of companies that allow exceptions. For example: “We’re at a sensitive stage of our relationship with Client X so we’re not going to include them”. In many cases, it’s more blatant. Clients are excluded because everybody knows they will give poor feedback. A proper governance structure is required to ensure ‘gaming’ is kept to a minimum. This gives the survey process credibility.

5. Is the survey carried out by an independent third party, or is it an in-house survey?

In-house surveys can be cost-effective but suffer from a number of drawbacks. The main drawback is that they generally result in inflated scores. For starters, in-house surveys are rarely confidential and are more prone to ‘gaming’ than surveys run by an independent third party. We have seen cases where in-house surveys have been replaced by external providers and the NPS scores have dropped by a whopping 30 points or more. Seriously, the differences are that significant.

So what is a GOOD NPS score for B2B companies?

Now, let’s get back to the question of what constitutes a good B2B Net Promoter Score. Here’s our take on it.

Despite the claims that one hears at conferences and on the Internet that “we achieved +62 in our last NPS survey”, such scores are rarely if ever achieved. We’ve collected NPS data for B2B clients across 86 different countries since 2006. Our experience is that in a properly-governed independent confidential assessment, a Net Promoter Score of +50 or more is extremely rare. Think about it. To get 50, you need a profile like the one below, where a significant majority of responses are 9 or 10. In Europe, that simply doesn’t happen.

B2B Net Promoter Score
Our experience of B2B assessments is that A NET PROMOTER SCORE OF +30 IS EXCELLENT and generally means you are seen as ‘Unique’ by your customers.

A NET PROMOTER SCORE OF ABOUT +10 IS PAR FOR THE COURSE. Consider +10 to be an average NPS score for a B2B company in the UK or northern Europe.

Note that negative Net Promoter Scores are not unusual. Approximately one third of Deep-Insight’s B2B clients have negative scores. One in 10 has a score of -30 or even lower.

Benchmarking

One final comment about benchmarking. Deep-Insight’s customer base is predominantly northern European or Australian. However, many of our clients operate in eastern or southern Europe – and in Asia or North America. We need to be careful about how we benchmark different divisions within the same company that are in different regions.

In our opinion, the best benchmark – for a company, business unit or division – is last year’s score. If your NPS is higher this year than it was last year, then you’re moving in the right direction. And if your NPS was positive last year, and is even more positive this year, happy days!

* Net Promoter® and NPS® are registered trademarks and Net Promoter SystemSM and Net Promoter ScoreSM are trademarks of Bain & Company, Satmetrix Systems and Fred Reichheld