One of the questions we get asked a lot is: “What sort of completion rates do you guys normally get on an assessment?”
Well, the answer is that it depends on what sort of assessment you’re talking about – we provide feedback on relationships with customers, channel partners and suppliers, and the completion rates differ from one type of assessment to the next:
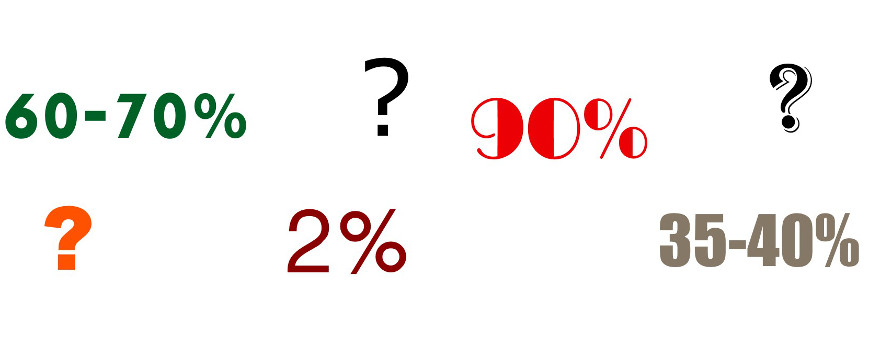
-For employee assessments, our typical completion rate is in excess of 90%.
-For corporate customer and channel partner assessments, it’s typically 35-40%.
-For supplier assessments, the average completion rate are somewhere in the middle: 60-70%.
 The next question we get asked is “Is it really that high?”
Well, we mainly get asked that question in connection with customer assessments, as some of our clients think 35-40% sounds impressive. This is particularly the case when people compare our figures to the ones you might get on a typical consumer surveys, where sometimes as few as 2% of consumers will bother to complete a questionnaire (Petchenik & Watermolen, 2011).
Remember that we are talking about existing, often long-standing, business-to-business (B2B) relationships – that’s what we do at Deep-Insight. We’re not a consumer research company. In fact, we’re not even a market research company, although we often are compared to firms like TNS or Gallup. We’re different. We look at – and assess – the quality of the relationships that large companies have with their biggest B2B clients. And if you think about it, why would good customers NOT want to provide feedback on their relationship with you, particularly if their account manager has convinced them that it’s an important part of their ongoing customer feedback process, and that their input is genuinely used to help improve the service given not just to them but to all clients?
The 5 pieces of advice I give to our clients are:
1. Spend Time Getting A Good Contact List Ready.
Most of our clients tell us they can pull together a list of key client contacts in a week. Two at the most. Our experience tells us that it takes at least 4-6 weeks to come up with a really good clean list of customer contacts who have a strong view of their relationship with our client. If the list isn’t compiled properly, we end up polling the views of people who really don’t have a strong view on the company, and who won’t be interested in responding.
2. Pre-Sell The Assessment To Customers.
One of our clients has been achieving customer completion rates in excess of 70% on a consistent basis for the past number of years. It does this because the CEO – together with the account managers – has managed to convince his key accounts that the 10-15 minutes they invest in providing feedback WILL result in a better service. “Tell me what’s wrong, and I promise we’ll do our best to fix it.”
3. Make Sure to Contact Customers While The Assessment Is Live.
We normally hold our assessments open for two weeks and we know from experience that if account managers have been properly briefed to mention the assessment in every conversation they have with a client during those two weeks, the completion rates will improve dramatically.
4. Manage The Campaign Smartly.
This is not rocket science, but you would be amazed at the number of companies that want to run assessments over school holiday periods, or during particular times of the year that may coincide with the most most busy time of the year for their customers. Plan your launch dates in advance, and think about the timing for issuing reminders. We usually recommend launching a customer assessment on a Tuesday morning, with the final reminder going out on the Tuesday two weeks later. That means that even if somebody is out of the office for two weeks, they’ll still have an opportunity to provide feedback.
5. Don’t Panic At The End of Week 1.
We normally see a flurry of activity during the first six or eight hours of a B2B campaign and typically the completion rate after Day 1 is about 8%. At the end of the first week (before we send out a first reminder) it’s often the case that the response rate hasn’t broken through the 10% barrier. This is not unusual. Completion rates will increase and a message in the final reminder that “This assessment is closing today” usually elicits a final flurry of responses!
As I said, a lot of this isn’t rocket science but it does require a bit of advance planning. If you do put the effort in up-front, you’ll see it rewarded in significantly higher completion rates.
 Susan – Sales Director
 Bill – Marketing Director