We are delighted to announce two new clients at Deep-Insight. Both have a strong maritime feel.
Survitec
Survitec is a global leader in survival and safety solutions to the marine, defence, aviation and offshore markets. It has over 3,000 employees worldwide, covering 8 manufacturing facilities, 15 offshore support centres and over 70 owned service stations. Survitec also has a network of over 500 third party service stations and distributors.
Across its 160-year history, Survitec Group has remained at the forefront of innovation, design and application engineering. It is the trusted name when it comes to critical safety and survival solutions. The new management team has made a commitment to focus the company around its customers.
In a recent interview for SAFETY4SEA, Survitec’s newly-appointed Managing Director for its Marine Division, Baba Devani explains how the world’s leading safety and survival partner is restructuring to become more customer-centric.
Port of Newcastle
Port of Newcastle is the largest port on the East Coast of Australia. As a global trade gateway for more than 220 years, the Port of Newcastle delivers safe, sustainable and efficient logistics solutions for its customers. It is also the largest coal exporting port in the world.
Port of Newcastle’s customers include coal producers in the Hunter Valley, non-coal traders including fuels, alumina, wheat, mineral concentrates and fertiliser manufacturers, as well as some of the world’s largest shipping lines.
The Port of Newcastle is at an early stage of development of a customer-centricity programme. Deep-Insight is delighted to be helping CEO Craig Carmody and his management team on that journey.
A big Thank You to all of our clients and channel partners who completed our CRQ assessment this year! It provided us with a wealth of feedback. We are humbled that you have given us such positive scores and we are thrilled with both the overall results and the detailed responses that we received.
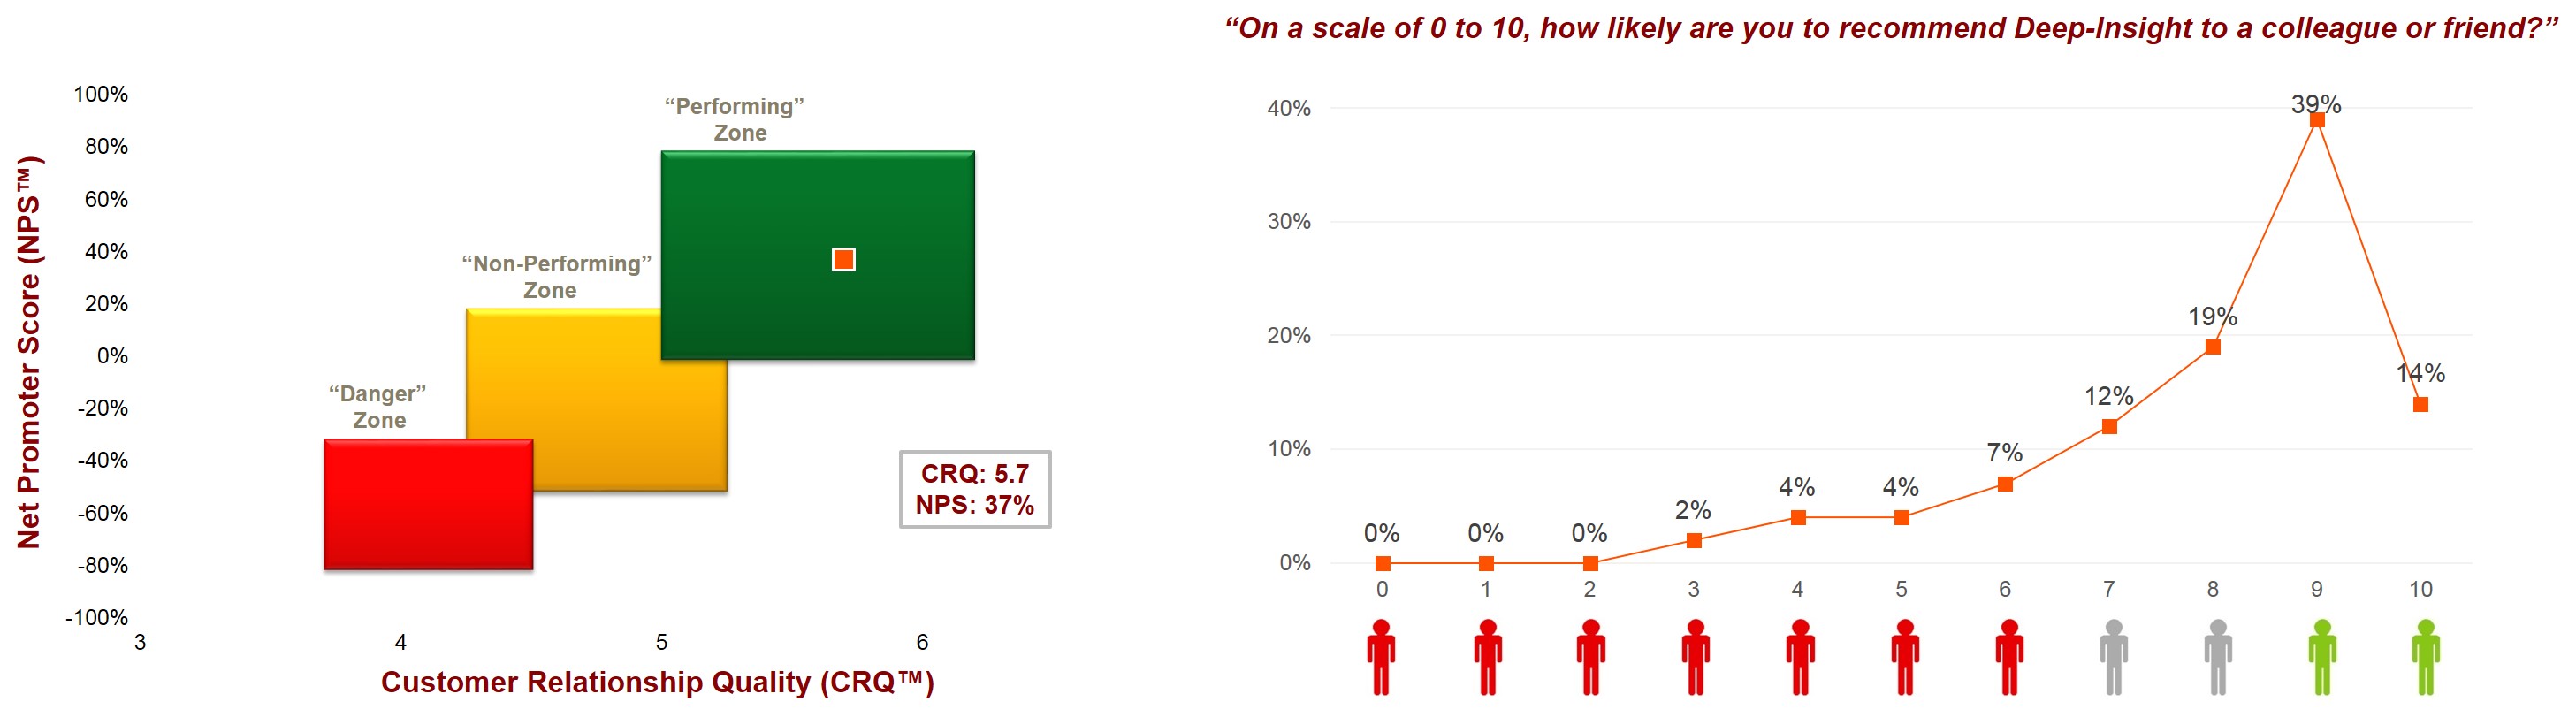
In summary: we had an overall completion rate of 49%, a CRQ score of 6.0 and a Net Promoter score of +53%. This is the strongest set of scores that we have ever received.
Regaining our Unique Status
Our scores this year mean that we are now back into ‘Unique’ territory, which we just missed out on last year. Uniqueness requires a combination of a winning ‘Solution’ and a great ‘Experience’. Last year, our ‘Solution’ scores had slipped and over the past 12 months we have been working hard to regain this ‘Unique’ status. It’s very gratifying to see all of our hard work paying off.
Deep-Dive: New and Improved
We have reflected a bit on last year’s journey for Deep-Insight and why we regained our Unique status. As a result of your feedback last year, we took your comments on board and put together a plan to upgrade our Deep-Dive platform. As a result, we have recently rolled out Deep-Dive v1.1 which is faster, has more features and allows our clients to access individual account reports at a click of a button. The work that the development team put into Deep-Dive has paid off as we have seen our ‘Solution’ scores increase from 4.9 to 5.7 this year and we have already received some very positive feedback regarding our upgraded Deep-Dive platform.
Our Plans for 2019?
Even though we received an amazing set of scores this year and we are thrilled with the results, that does not mean we will take a break. We have put our heads together and came up with the following action points for the upcoming months.
No. 1 – Share Results with All Clients – and Create Joint Action PLans
We tell our clients to share their results with their customers as this is a very effective way of building strong relationships. In the past we have sometimes been guilty of not taking our own advice but this year we plan on doing exactly that with all of our clients. Expect us to reach out to you in the very near future so that we can review your feedback together and see how Deep-Insight can be more effective this year at helping you achieve your 2019 objectives.
No. 2 – More Support with Account Management
This year we asked you to what you use our services for. The answer? You use Deep-Insight and primarily as an Account Management/ Customer Retention tool, followed closely by Customer Experience feedback.
The message for us at Deep-Insight is that we need to spend more time with our clients at the start of any assessment to understand how you segment your client base, how you allocate account managers and service teams to those accounts, and how we can help you get more account-based insights from using the Deep-Dive platform. We also need to be more supportive in helping you use the results to manage those accounts more effectively. This is one area we would specifically like to explore with each of you in the coming weeks.
No. 3 – Aim for a Higher Response Rate in 2020
This is more of an internal action for us at Deep-Insight. A 49% response rate is not bad but we know that some of you set targets of 60% or higher, and you achieve them. We will be aiming for a 60% completion rate in 2020. We always advise our clients to work with their account teams to achieve the highest response rate possible, so for next year we will definitely put a stronger focus on this for ourselves as well.
Thank you again for your time and input into this year’s customer assessment. We will be in touch shortly.
We’re used to handling questions on how to make CX programmes more effective. One of the most common questions we get from first-time clients is: “What completion rates can I expect from my CX programme?” Another common question from longer-term clients is “How do I improve my completion rates?”
Let’s deal with each question in turn.
“What Completion Rates can I expect from my CX programme?”
Let me preface this by saying that we are talking about business-to-business (B2B) relationships so there is an inherent assumption in the question that our clients have some existing – and hopefully strong – relationships with their customers and that these contacts will be receptive to a request to give feedback as part of that ongoing relationship.
This is usually the case but clients – particularly senior clients – are busy people so it may not come as a surprise to hear that the average participation rate in a B2B customer assessment is around 35%.
But that 35% figure is an aggregate score and there’s a little more to it than that, if you have a look at the graph below.
The spread is wide.
The most common completion rate is in the 26-30% range. We have a smaller number of clients – typically those who have been running our Customer Relationship Quality (CRQ) assessments for many years – who regularly achieve completion rates of 50% and higher.
If this is your first time running a customer assessment – either a simple Net Promoter Score survey of something a little more complex like our CRQ relationship assessments – you can expect completion rates of less than 1 in 3.
This may sound OK if you regularly run consumer surveys where a 5% completion rate can be a good result, but for an existing long-standing B2B client relationship, it’s paltry. And yet we have been running customer assessments of all sorts for nearly 20 years and these are the actual numbers.
So now let’s get to the second question:
“How do I improve my completion rates?”
The starting point is to understand why some B2B companies sometimes get really low completion rates and others consistently exceed 50%.
Our lowest-ever completion rate (4%) came from a first-time UK software client. The quality of contact data was simply terrible. We should have spotted that it was little more than a ‘data dump’ from the company’s CRM system. The list included people who had left their companies three years earlier. It included people who had never even heard of our client. It probably included the names of people who were dead. That’s because there was no governance in place for the programme. The Sales Director was not involved. Account Managers did not personally sign off the client contact names. You get the picture.
Our highest-ever completion rate came from a company that has been a client of Deep-Insight’s for 10 years and whose customers view the annual CRQ assessment as a critical part of their ongoing strategic partnership.
But there are other reasons for low and high participation rates. Here’s a quick summary of the profiles of our clients that fit into both categories:
6 Steps to Improve your Completion Rates
Here are the steps you need to take to get your completion rates up:
Make It Strategic. If the CX programme is CEO-led and driven from the top, it will not be seen as another box-ticking exercise. Make sure this is a key item on the Executive agenda.
Put in Governance Structures. By this we mean things like: a) Account Directors should supervise and sign all contact names, not just pull them from the CRM system; b) the Sales Director should personally sign off all Strategic Client contact names.
Don’t call it a Survey! At Deep-Insight, we ban the use of the term “survey” . For us, a CRQ assessment is a strategic ongoing conversation with the clients and their views will be taken seriously.
“Warm Up” the Contacts. An invitation to complete a survey should not come out of the blue. Ideally, it should be introduced by letter or by email by the CEO or Country Manager, and while an assessment is “live”, the account manager will know to stay in touch with the client and urge them to complete the assessment.
Close the Loop. This is critical. If you ask for feedback, you need to share that feedback with the client, agree the actions that BOTH PARTIES will take to improve the relationship.
Repeat. Get into a rhythm where your clients and your sales/account teams know that every February or October (or whenever), the annual strategic assessment will take place. You may want to run frequent assessments. Some companies have quarterly Net Promoter or Pulse assessments – but don’t overdo the frequency. Your organisation needs time to put remedial actions into effect.
Completion Rates of 90% or more?
Follow the above steps and you’ll get your completion rates to 50% or higher.
But remember that these completion rates are at an individual level. You should be getting feedback from multiple people at different levels within each client. Include Influencers and Operational Contacts as well as Key Decision Makers. That way you’ll get a wealth of information about what your key accounts REALLY think of you.
You’ll also get completion rates of 90% at an account level if you take this approach.
If you are interested in reading more about running a CX programme effectively take a look at our process for running a B2B CX assessment or just get in touch with us today for a chat.
Some years ago, the focus of NPS discussions changed. At least, in the USA they did. It used to be: “How do I measure NPS?” and now it’s: “How do I improve my Net Promoter Score?”
Remember that Net Promoter Score is an American metric for customer advocacy. Europe is still a few years behind the USA. The topic of how to improve NPS results will dominate executive leadership discussions in Europe for the next few years. If you’re a leader in a European B2B company that is already measuring NPS, this blog is for you. It’s about the 5 actions to improve your Net Promoter Score.
Insight from a Decade’s Worth of B2B NPS Data
Deep-Insight has been gathering NPS data since 2006. We gathered this data from B2B firms operating across a variety of different industries in over 80 countries. A few years ago, we integrated NPS into our Customer Relationship Quality (CRQ) methodology. We now have tens of thousands of data points – exclusively from B2B companies – showing which items are strongly correlated with NPS and which are not.
A quick word on our terminology:
We call accounts where you have the strongest and deepest relationships Ambassadors. An Ambassador typically has many ‘Promoters’ and few ‘Detractors’. We call companies at the other end of the relationship spectrum Stalkers and Opponents. These accounts typically have few ‘Promoters’ and large numbers of ‘Detractors’.
The pie chart on the right shows a client portfolio for a typical European B2B organisation. Most accounts have good relationships, and a third have excellent relationships.
As the graphic on the left shows, the key elements of any business relationship are Trust, Commitment and Satisfaction. Each of these elements is highly correlated with a customer’s willingness to recommend. In other words, their willingness to give you a good Net Promoter Score.
Trust, Commitment and Satisfaction are only the outcomes of other elements of performance so we need to delve deeper. By doing so, we’ll find out which areas to concentrate on in order to improve a company’s Net Promoter Score.
5 Actions to Improve your Net Promoter Score
Based on more than a decade’s worth of data, we know the five key actions to improve your Net Promoter Score.
First things first. Any large account is likely to have a combination of Promoters, Passives and Detractors. Different strategies are required for dealing with each category. The actions required to turn Detractors into Passives are not the same as the actions required to turn Passives into Promoters.
Here’s a quick summary of those 5 actions.
Turn Detractors into Passives
1. MAKE YOUR CUSTOMERS FEEL VALUED. The one thing you should do, above everything else, to turn Detractors into Passives is to have empathy with them. Show a willingness to engage. Listen to them and make them feel valued. People give extremely low advocacy scores (0 – 3 out of 10) when they feel unloved and frustrated. Unloved because they are ignored. Frustrated because they believe you are not interested in solving their problems. Even if there is little you can do immediately to fix their problems, tell them that you understand how they feel. Let them know you will do your utmost to address their issues. But be honest. If it’s going to take six months, don’t say six weeks.
Convert Passives into Promoters
2. DIFFERENTIATE YOURSELF FROM YOUR COMPETITORS. The more you differentiate yourself from the competition, the more you will be seen as ‘Leading Edge’. Our analysis tells us that if you are perceived as a leading-edge company, your NPS score will be higher. By the way, there’s no point in trying to discuss innovation with Detractors. They’re not in listening mode. What they want is for you to address their immediate problems. Do that and you will earn the right to chat about innovation. Not before.
3. PROVIDE VALUE FOR MONEY. This is linked to the previous point. The more differentiated you are and the more unique your offering is, the greater the value you deliver to your clients. Passives think you provide good value for money. Promoters think you provide excellent value for money. Price is rarely the issue. Focus of what you can do to increase the value of what you deliver rather than on the price at which you deliver it.
Actions – All Customers
4. MAKE IT EASY FOR YOUR CUSTOMERS TO DO BUSINESS WITH YOU. Regardless of whether you are a Promoter, Passive or Detractor, there is a high correlation between ‘Ease of Doing Business’ and NPS. Become less bureaucratic. Break down the silos between departments. Build cross-functional teams. Look at your processes and simplify them. Get your clients involved. Just ask them – they want to be included.
5. BE PROACTIVE. Customers want you to respond quickly and effectively to their needs. That means not just reacting to problems as they occur. It means anticipating problems BEFORE they occur. That’s what good account management is all about.
If you’re interested in turning NPS data into a full-fledged Customer Experience (CX) programme that improves retention rates and revenues, get in touch with us. We’d love to hear from you.
Deep-Insight works with clients across all industries. From experience we know it’s tougher to deliver services consistently well in some industries than in others.
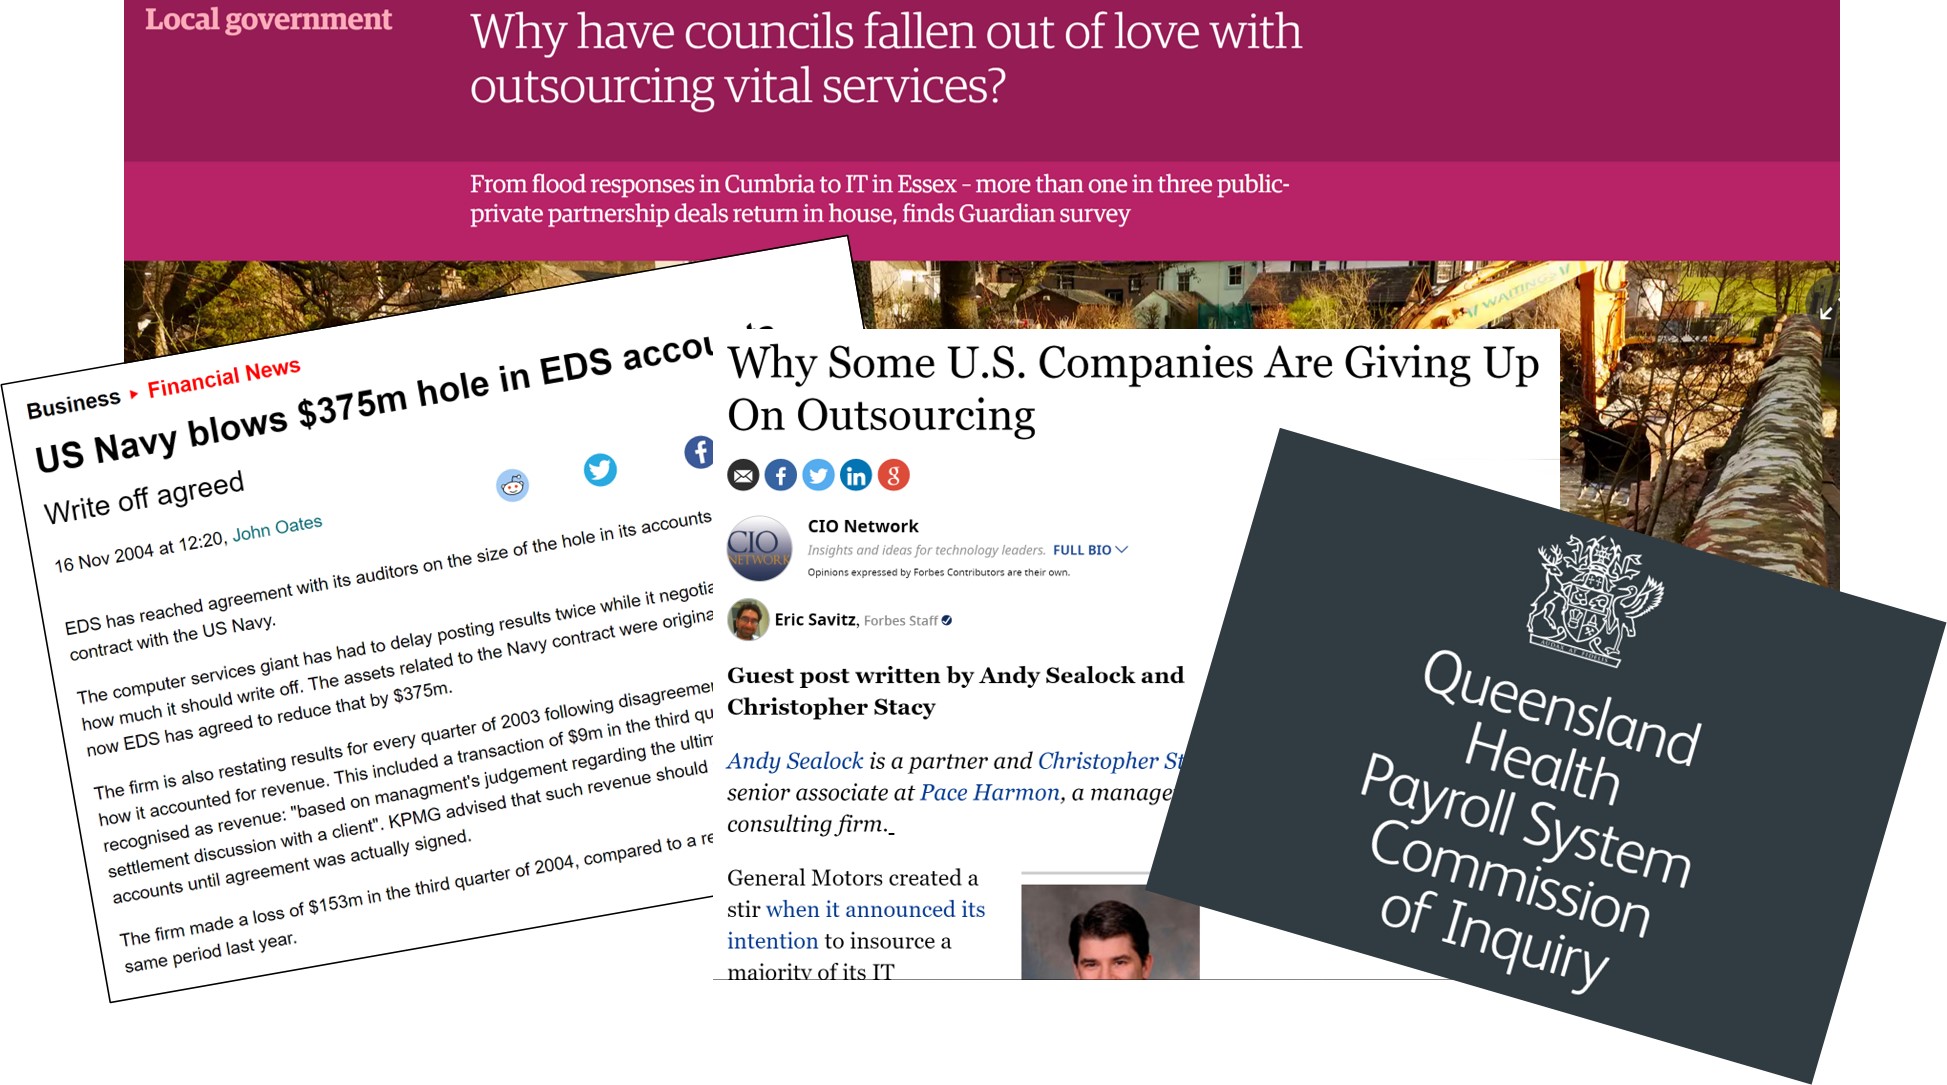
One particularly tough industry is Outsourcing. Outsourcing services include IT, payroll, finance, manufacturing, call centres, washroom services and so on. In fact, there are very few functions and processes that have not been outsourced. This phenomenon is not just confined to the private sector. Some of the biggest outsourcing deals involve the provision of services to local, regional and central government clients.
Over the past two decades, outsourcing has become commonplace. Companies have focused on core areas of expertise and hived off the remaining functions to specialist firms. The theory is simple: focus on your core competences and leave the rest to firms that can run those activities better, faster and cheaper. Unfortunately, many of these arrangements fail to deliver the expected benefits. Many service providers get badly burnt when large outsourcing contracts spiral out of control.
I spend a lot of my time with leadership teams helping them understand what their major corporate (and government) clients think of them. When I present their customers’ feedback – in the format of Customer Relationship Quality (CRQ) and Net Promoter Scores (NPS) – one of the most common questions I get asked is “Are those scores typical in our industry?”
Put it another way. Clients want to know what a ‘good’ CRQ or NPS score is for their industry.
Some industries are different
Many executives tell me that their industry is different. My standard response is that the nature of a business relationship is the same regardless of industry. There should be little difference in CRQ or NPS scores across industries. The fundamentals of business relationships are the same.
And yet, in practice, some industries ARE different. For example, corporate banks seem to find it easier to build strong relationships with their clients than companies that provide complex outsourcing solutions.
So why is this? Why is it so difficult for Outsourcing companies to get really good customer feedback and scores? And – back to the title of this blog – what is a ‘good’ Net Promoter Score if you operate in the Outsourcing industry?
7 Deadly Sins of Outsourcing
Several academics such as Jérôme Barthélemy have tried to address this question. Jérôme has identified the “7 Deadly Sins of Outsourcing” – the pitfalls that companies blunder into when they make a decision to outsource a process or entire function to a service provider. These seven sins are:
– Outsourcing activities that should not be outsourced – Selecting the wrong vendor – Writing a poor contract – Overlooking personnel issues – Losing control over the outsourced activity – Overlooking the hidden costs of outsourcing, and – Failing to plan an exit strategy (i.e., vendor switch or reintegration of an outsourced activity)
The Terrible Three
It’s not just the company that’s doing the outsourcing that’s at fault. The vendors – or outsourcing service providers – have their own deadly sins, the most common of which (the Terrible Three) are the following:
– The Sales/Delivery Gap. This typically happens when a vendor has a ‘bid team’ that competes for new contracts. Before the ink is dry on the contract, the bid team has moved on to the next major deal. They leave the delivery and implementation to a completely different team that looks at the contract and shouts: “WHAT? You expect us to deliver that? With those resources? And for that cost?”
– The Efficiency Challenge. Outsourcing providers need economies of scale to make money. The unit cost of providing payroll services to 10 companies is lower than to a single company, but only if the service provider can establish a large efficient ‘factory’ for the delivery of these services. In most cases, the ‘factory’ managers operate on principles that are based on efficiency and cost containment rather than on delighting the customer.
– The Offshoring Issue. One way of achieving lower costs is through ‘offshoring’ – locating the ‘factory’ in another part of the world where labour costs are significantly lower. So the UK service provider moves the IT development to India. The Australian service provider transfers the call centre functions to the Philippines. Nothing wrong with that, as long as it’s meticulously planned and executed. Very often it’s not, and even when it is, there are always teething problems.
What is a GOOD Net Promoter Score for an Outsourcing company?
In a previous blog I said that an ‘average’ Net Promoter Score for a European B2B company is in the region of +10 and that scores in excess of +30 are excellent.
Our experience is that an ‘average’ NPS score for Outsourcing companies is negative – typically in the region of -10 and that any NPS result in positive territory can be regarded as a good result.
So there you have it. Zero CAN be a good Net Promoter Score for some European B2B companies!
If you are a senior executive in a company that provides outsourcing services, you can settle for mediocrity and target your staff to achieve a zero or slightly positive NPS. Alternatively, you can work with your clients to make sure they avoid the 7 Deadly Sins (as well as making sure you avoid the Terrible Three internal sins). If you’re successful, you’ll outperform the competition and make much greater profits for you and your shareholders.